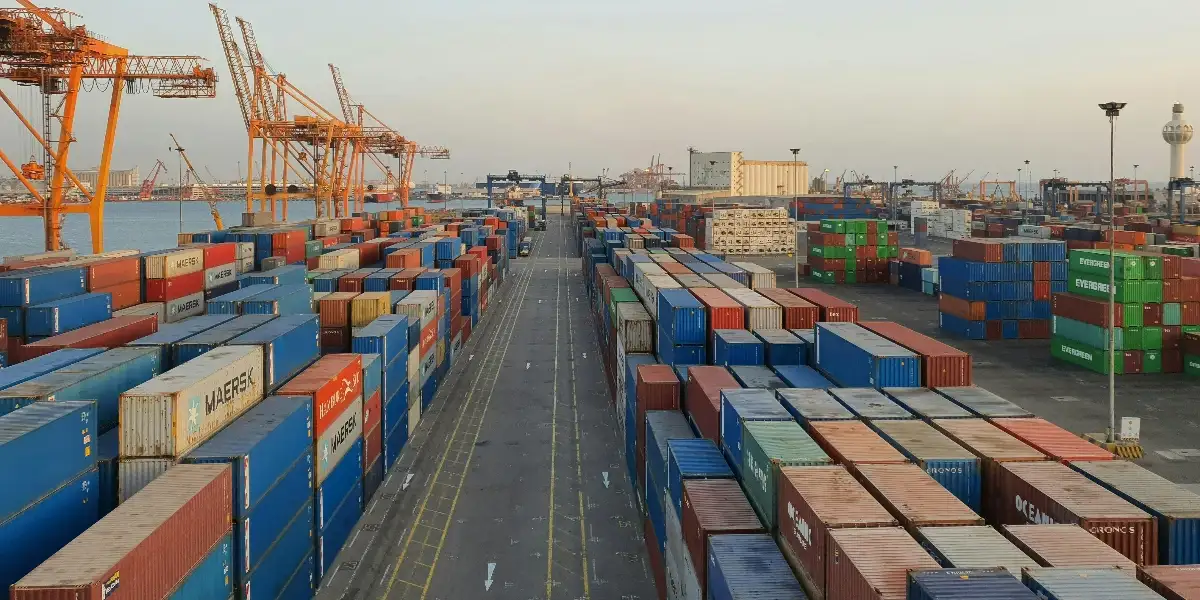
Imagine a logistics manager frantically switching between browser tabs — port websites, carrier notifications, and internal spreadsheets. A critical shipment worth millions is currently somewhere in the maze of the Long Beach port, and every hour of delay means mounting demurrage costs.
- The manager knows the port is congested, but how congested is it?
- Should they reroute future shipments?
- When will conditions improve?
The answers are scattered across disconnected systems. By the time they're assembled, the information is already outdated.
Traditional workflow: Log into dashboards → Export to spreadsheets → Cross-reference manually → Send email updates → Repeat.
Every step increases the risk of delay, error, and missed opportunities.
Traditional port monitoring depends on fragmented data and reactive processes.
What's needed is a direct way to bring real-time port conditions into your internal systems, enabling automated decisions based on up-to-date insights.
What We Introduced
We've launched the Portcast Port Congestion API, a direct way to access real-time congestion metrics for global ports through a single API call.
Instead of piecing together data from multiple sources, your systems can now retrieve current congestion levels instantly.
This enables logistics and planning teams to automate key workflows, such as rerouting, customer updates, and resource allocation, all within your existing infrastructure.
What the Portcast Port Congestion API Does

The API provides daily and weekly congestion data for over 1,000 ports worldwide, in a structured format that's easy to integrate into TMS platforms, planning tools, and internal dashboards. Here's what it offers:
- Daily metrics: Count of vessels that berthed at port, count of vessels waiting at anchorage, total waiting time (from arrival at anchorage to berth), and comparative 365-day rolling average of total waiting time
- Weekly analytics: Median, mean, and upper range percentiles of vessel waiting and vessel dwell times
- Congestion category: Each day’s activity is labeled as LOW, MEDIUM, HIGH, or LONG-TAIL to support both human decision-making and automation
- Port metadata: Coordinates for location-based logic and routing use cases
Input required: Port UN/LOCODE and optional date ranges
Output: JSON response ready for integration into enterprise systems
The API also supports the analysis of historical congestion trends, providing access to up to two years of past data. This enables operations and planning teams to assess how port performance has evolved over time, identify recurring congestion patterns, and improve future planning based on historical trends.
The Port Congestion API from Portcast lets your systems retrieve congestion data on demand, without relying on manual lookups or spreadsheet exports.
Simplifying Complex Metrics with a 4-Level Category System
Percentile-based wait times are helpful for analysis but can be challenging to act on quickly.
That's why the API translates this data into four clear categories:
LOW | MEDIUM | HIGH | LONG-TAIL
- LOW: Median waiting times are consistently under 1 day. The top 10% of vessels experience delays of less than 3× that of the majority. This indicates low impact and minimal variability.
- MEDIUM: Median waiting times range from 1 to 3 days. Outlier delays remain under 3× the average, indicating moderate congestion without significant spikes.
- HIGH: Median waiting time exceeds 3 days. This reflects broader congestion affecting most vessels calling at the port.
- LONG-TAIL: This category captures congestion affecting a specific subset of vessels. While the overall median wait time remains under 3 days, the top 10% of vessels face delays at least 3× longer than the rest. These situations typically result from localized disruptions, such as issues at a particular terminal or weather conditions impacting certain vessel types.
This structure enables teams to respond faster:
- Operations teams immediately understand congestion severity
- Systems can trigger programmatic actions or alerts
- Analysts can still access the full underlying dataset
Why It Matters
Port disruptions are no longer limited to peak seasons. Geopolitical events, climate extremes, and infrastructure challenges have made congestion unpredictable and frequent. Yet many supply chain teams still rely on outdated monthly reports or reactive notifications.
The result?
❌ Missed rerouting opportunities
❌ Delays that impact production schedules
❌ Breached SLAs and unhappy customers
❌ Rising operational costs due to late response
With Portcast's Port Congestion API, teams can track conditions in real-time, identify disruptions early, and act before delays escalate.
How One API Call Powers Better Decisions Across the Supply Chain
Here's how the API can improve performance across multiple functions:
- Route Planning: Adjust vessel routing based on real-time congestion data across alternative ports
- Exception Management: Trigger internal or customer alerts automatically when HIGH or LONG-TAIL congestion is detected
- Procurement and Forecasting: Use congestion history to support smarter contract negotiations and more accurate forecasts
- Terminal and Resource Planning: Allocate staff and yard resources more effectively using expected vessel activity and wait times
One API call can enhance visibility, responsiveness, and efficiency across your logistics network.
Getting Started
The Port Congestion API is now available and designed to integrate easily with Portcast's Web App features or your own internal tools.
You can:
- Start with a simple query using a port code and a date range
- Explore our detailed API documentation
- Use it alongside the Port Congestion Dashboard for a full operational picture.
👉 Explore the API documentation
📩 Or contact our team to discuss integration strategies.