As the Strait of Hormuz shipping disruption situation evolves and vessels reroute to avoid the uncertainty, the effects are showing up at ports across Asia in the form of longer queues, slower berth access, and rising delays. Portcast has been monitoring major ports across the region, and the data from the past few weeks shows that congestion is building, and shippers need to pay attention.
Strait of Hormuz Current Status and Its Impact on Port Congestion
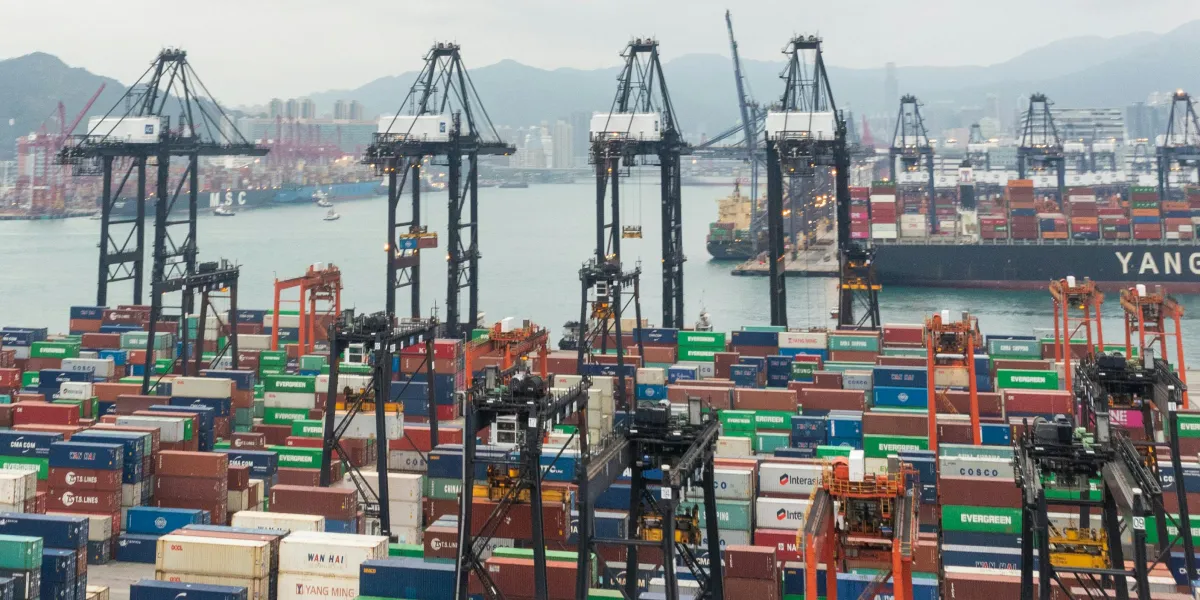
The Strait of Hormuz is not fully closed, but the Hormuz shipping disruption has been significant enough to alter vessel behaviour at scale. Ships are holding, rerouting, or bunching at alternative ports while operators wait for clarity. The result is a spike in traffic at transhipment hubs and gateway ports that were not designed to absorb this kind of sudden demand shift.
Across the ports Portcast monitors, a clear pattern has emerged since late February 2026. Anchorage queues that were stable through January have surged into March. More vessels are waiting. Berth access is taking longer. And the ports feeling it most are the ones that sit at key transhipment and relay points along the affected trade lanes.
Where Strait of Hormuz Shipping Traffic Is Piling Up
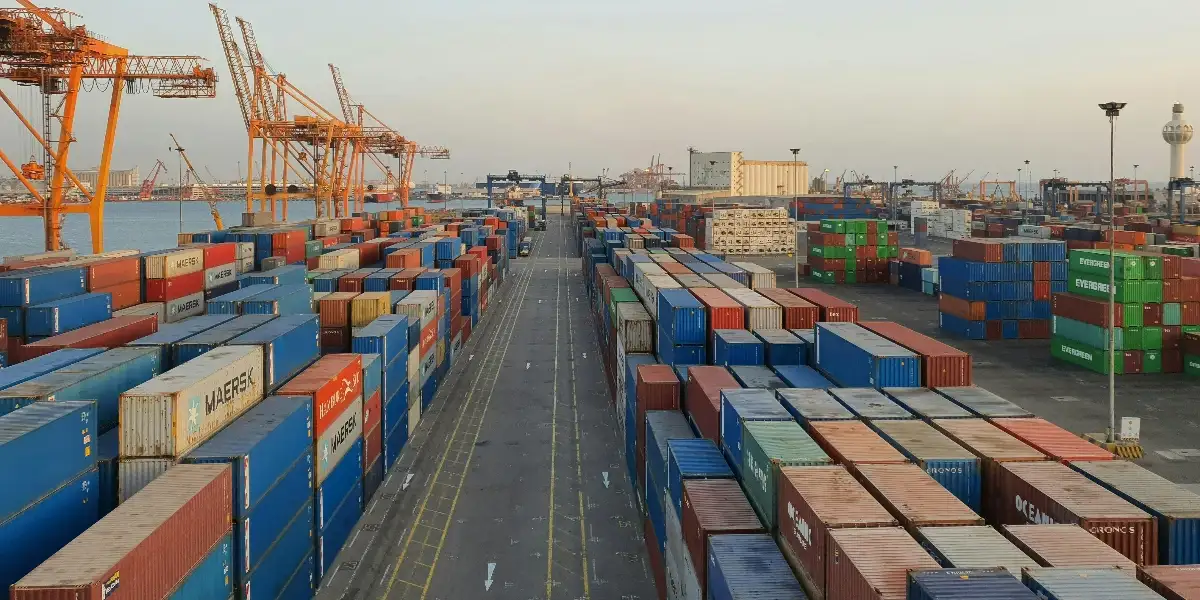
This port congestion is not limited to a single country or port. It is happening at the same time across Southeast Asia and South Asia, suggesting a shared cause instead of local port problems.
As of March 13th, here is the port congestion trend based on data from our platform:
Port Congestion Waiting Report
Daily Anchorage Waiting by Port
Date range: 2026-01-12 to 2026-03-13. Yellow marker shows the start of the Middle East conflict on 28 Feb 2026.
SINGAPORE (SGSIN)
SINGAPORE
Daily Vessels Waiting at Anchorage
Latest vessels waiting at anchorage: 23. Day-over-day change: ▼ 42.5%. 7-day average: 38.4 vs previous 7-day average 24.9 (▲ 54.6%).
COLOMBO (LKCMB)
SRI LANKA | COLOMBO
Daily Vessels Waiting at Anchorage
Latest vessels waiting at anchorage: 18. Day-over-day change: ▲ 28.6%. 7-day average: 12.3 vs previous 7-day average 9.9 (▲ 24.6%).
MUNDRA (INMUN)
INDIA | GUJARAT
Daily Vessels Waiting at Anchorage
Latest vessels waiting at anchorage: 15. Day-over-day change: ▲ 25.0%. 7-day average: 10.6 vs previous 7-day average 5.4 (▲ 94.7%).
NHAVA SHEVA (INNSA)
INDIA | MAHARASHTRA
Daily Vessels Waiting at Anchorage
Latest vessels waiting at anchorage: 7. Day-over-day change: ▲ 16.7%. 7-day average: 6.4 vs previous 7-day average 3.7 (▲ 73.1%).
KARACHI (PKKHI)
PAKISTAN | SINDH
Daily Vessels Waiting at Anchorage
Latest vessels waiting at anchorage: 3. Day-over-day change: ▲ 50.0%. 7-day average: 2.6 vs previous 7-day average 2.6 (▲ 0.0%).
LAEM CHABANG (THLCH)
THAILAND | CHON BURI
Daily Vessels Waiting at Anchorage
Latest vessels waiting at anchorage: 7. Day-over-day change: ▼ 12.5%. 7-day average: 9.7 vs previous 7-day average 8.7 (▲ 11.5%).
SEMARANG (IDSRG)
INDONESIA | JAWA TENGAH
Daily Vessels Waiting at Anchorage
Latest vessels waiting at anchorage: 8. Day-over-day change: ▲ 33.3%. 7-day average: 8.7 vs previous 7-day average 9.4 (▼ 7.6%).
BUSAN (KRPUS)
KOREA (THE REPUBLIC OF) | BUSAN GWANG'YEOGSI [PUSAN-KWANGYOKSHI]
Daily Vessels Waiting at Anchorage
Latest vessels waiting at anchorage: 20. Day-over-day change: ▼ 20.0%. 7-day average: 19.6 vs previous 7-day average 8.7 (▲ 124.6%).
TANJUNG PELEPAS (MYTPP)
MALAYSIA | JOHOR
Daily Vessels Waiting at Anchorage
Latest vessels waiting at anchorage: 15. Day-over-day change: ▲ 15.4%. 7-day average: 13.7 vs previous 7-day average 6.9 (▲ 100.0%).
PORT KLANG (MYPKG)
MALAYSIA | SELANGOR
Daily Vessels Waiting at Anchorage
Latest vessels waiting at anchorage: 19. Day-over-day change: ▲ 72.7%. 7-day average: 19.4 vs previous 7-day average 17.1 (▲ 13.3%).
If you are looking for a predictive visibility solution for your ocean freight or help you navigate such scenarios with greater confidence, speak to our team to understand how Portcast can help you.
Conclusion
Subscribe to Our Newsletter
Stay up to date with a monthly digest of container shipping news and data insights by Portcast.