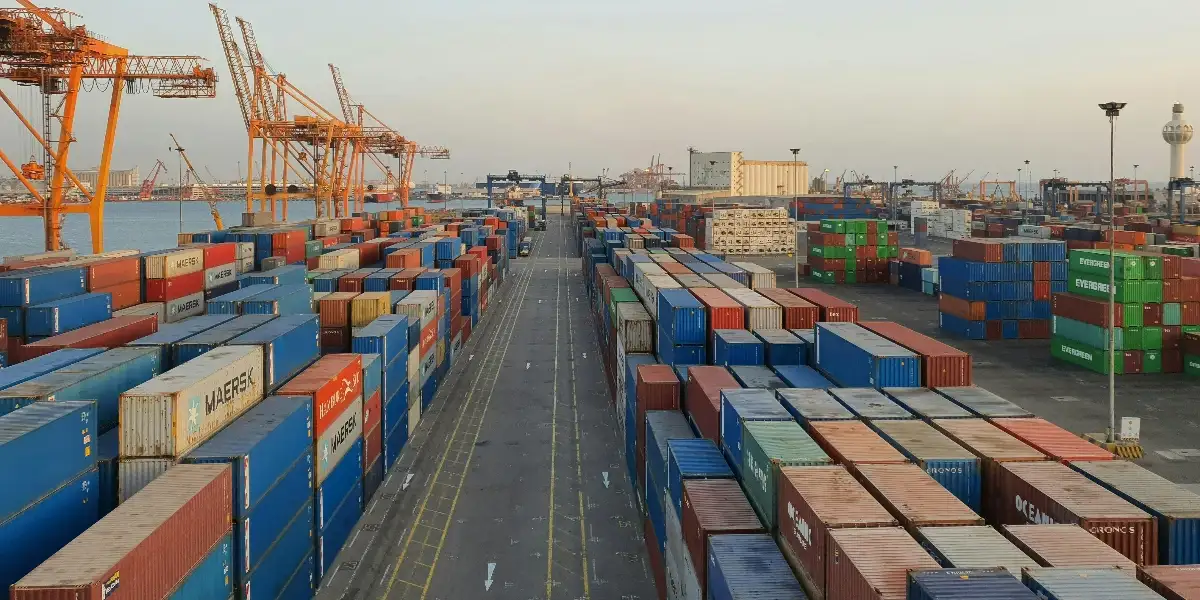
Traditional trade patterns at regional and global level, have changed quite dramatically over the past few years resulting in massive backlog of vessels, increased container dwell times and transit delays across major trade routes, perpetuating port congestion across the world.
Matters have also been aggravated by the supply-demand imbalance due to which containers and chassis (in the USA) were stuck in different places leading to shortage of containers and chassis, creating inland evacuation bottlenecks especially in the USA.
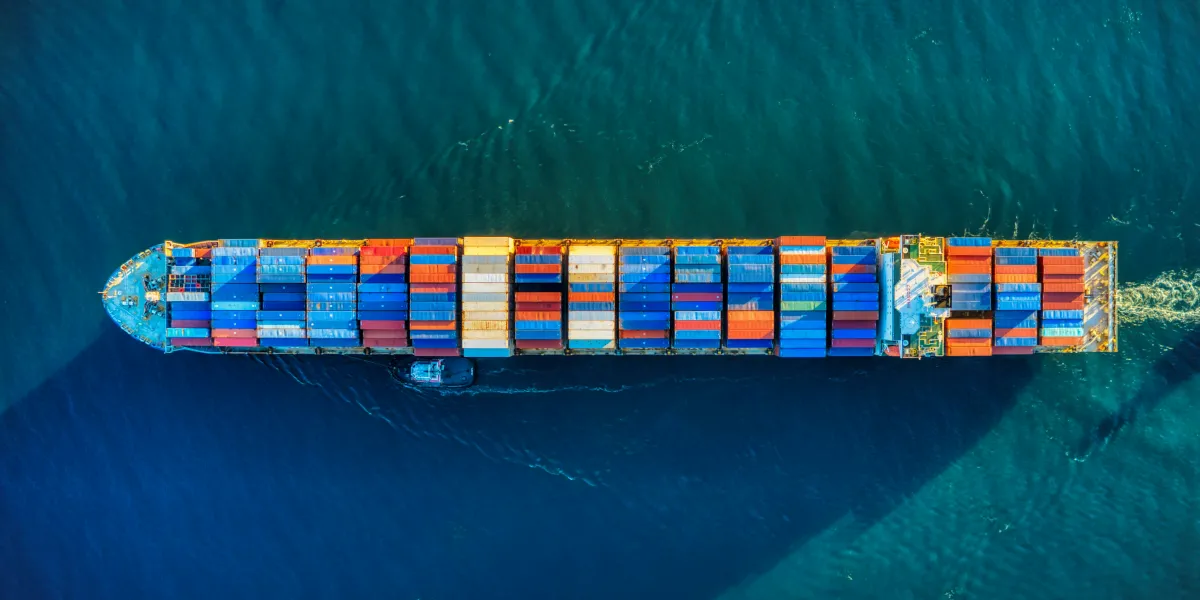
These events resulted in record ocean freight rates, prolonged delivery times, and poor schedule reliability levels, impacting manufacturers, retailers, and consumers alike.
Metrics related to congestion
Congestion influences port operations at various levels, which can be measured based on the following metrics:
- Vessel queues in port: This is the most obvious marker of congestion, with pictures of a packed swarm of vessels waiting outside the ports of Los Angeles and Long Beach creating headlines in 2020 and 2021. At the peak of congestion, the queue stretched to 109 vessels, a number which has recently come down to 8 vessels.
- Container Dwell times: Another metric that affects and also causes congestion is the dwell times of containers inside the port. At the height of the port congestion in the USA, container dwell time at various ports in the USA were alarmingly high.
- Transit times: A tell-tale sign of congestion is the abnormal increase in overall transit times. Transit times from China to US West Coast ports peaked at 50 days in December 2021 and decreased to 32 days in August 2022, in line with abating congestion levels. On the US East Coast, ports still grappling with severe congestion, transit times from China have seen only a marginal improvement, currently standing at 46 days, as compared to 50 days in April 2022.
- Rail Movement : Port-side congestion generally cascades down to inland points as well, resulting in inordinate delays in handling and evacuating containers. This is currently being witnessed in Los Angeles and Long Beach, where average rail evacuation times for containers were 16.5 days in August, as per the Pacific Merchant Shipping Association.
- Rerouting of shipments to another port before the original port: The phenomenon is both an indicator and a consequence of congestion. The most notable instance is the rerouting of cargo from USWC ports to USEC ports since the stifling congestion levels at USWC in 2020.
Where historically, volumes at USWC ports have been 40% higher than at USEC ports, the trend has reversed over the course of the past year, with USEC ports now handling more cargo than USWC ports.
Another recent example is container carriers skipping the port of Felixstowe (due to labor strikes), diverting cargo to other European ports like Hamburg, Antwerp, and Bremerhaven.
Ways to proactively manage Congestion
Some common tactics to avoid congestion, or mitigate the impact thereof, are explained below:
- Use second-rung ports: calling at smaller ports instead of the traditional gateways. Examples include substituting Port Everglades (USPEF) for New York (USNYC) and New Jersey or using the Port of Hueneme instead of Los Angeles.


- Reconfigure supply chains: to entirely bypass congested regions. A prime example is the numerous cargo owners opting to call at US East Coast (USEC) ports and avoiding US West Coast (USWC) ports. Another recent example involved carriers skipping the port of Colombo and calling at ports on the southern coast of India.
- Use alternate modes of transport: such as the rail corridor connecting China to European locations. As congestion spread to European ports in 2021, China-Europe rail volumes increased by 29%.
- Use multi-modal transport: involving a combination of sea-rail or sea-air. Japanese and South Korean exporters are increasingly using the sea-rail route, wherein the cargo is transported to China by sea and thereafter hauled to European destinations by rail.
How Technology can help mitigate the impact of Congestion
Apart from the operational measures described above, technological solutions play an increasingly crucial role in helping exporters avoid congestion.
Portcast is a prominent player in this field, providing predictive real-time visibility software that can help shippers plan their cargo movement and provide real-time visibility and ground-level updates. This information is useful in identifying potential bottlenecks and delays, enabling proactive steps to mitigate the consequences of congestion.
If you would like to learn more about how Portcast can benefit your business, schedule a demo!