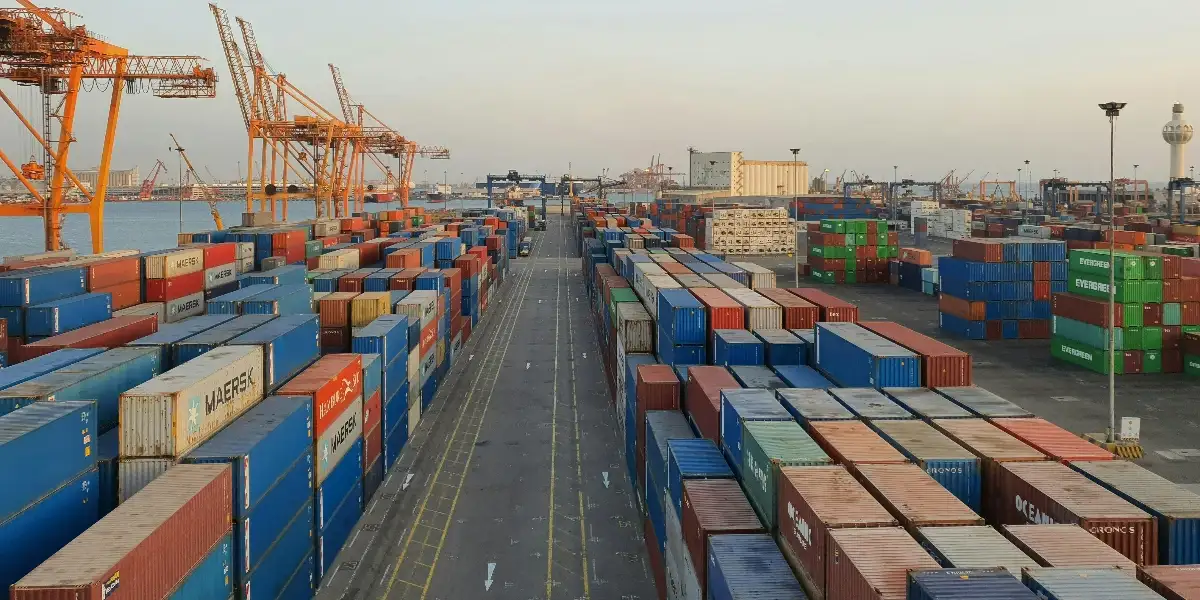
In a world where supply chain disruptions are common, port congestion is perhaps one of the major disruptors contributing to ocean cargo delays.
It manifests in the additional operational costs (including demurrage and detention; expedited air freight, and rescheduled pickup slots) as well as lost revenue throughout the supply chain. Understanding how one can measure port congestion is important to optimize your supply chain performance.
Measuring port congestion based on the number of vessels at the port can be misleading
One of the common indicators, the number of vessels at port, may be misleading since it fails to consider vessels that might be outside of the proximate port zone.
Let’s take a closer look at the port of Shanghai as an example. The number of vessels between January 2021 and July 2021 has consistently been high which could indicate higher than normal levels of congestion at port. Yet when the number of vessels decreased in November 2021, the median vessel delay was at times higher than at the peak of vessel occupancy from Jan-July 2021.


Whenever levels of congestion are high, vessels tend to start waiting outside of the port or at the anchorage area instead of the port geo fence. Similarly, in November 2021, ports of Long Beach and Los Angeles introduced the ‘queuing’ system that required cargo vessels to anchor and wait 150 miles off the California coast — rather than hugging the coastline in a large group packed within a 40-mile perimeter. In both instances, looking at the count of vessels currently at port would under-report true levels of congestion.

"Taking count of the vessels in the ‘proximity’ of the port can offer a more contextual picture of the port congestion levels"
Leading indicators of port congestion
Some of the common indicators of port congestion rely on historical data whereas only the vessels that have an ATA (Actual Time of Arrival) are considered. In cases where the port is not congested, the impact would be limited. However, whenever a port is indeed congested, this creates a lagging index. The information being reported is an outdated representation (frequently underreporting) of the current state of congestion at the port.

For ports like Los Angeles or Long Beach at the peak of congestion, the lag could add up to 4-6 weeks from the point of the vessel’s initial scheduled arrival to the ATA captured weeks later.
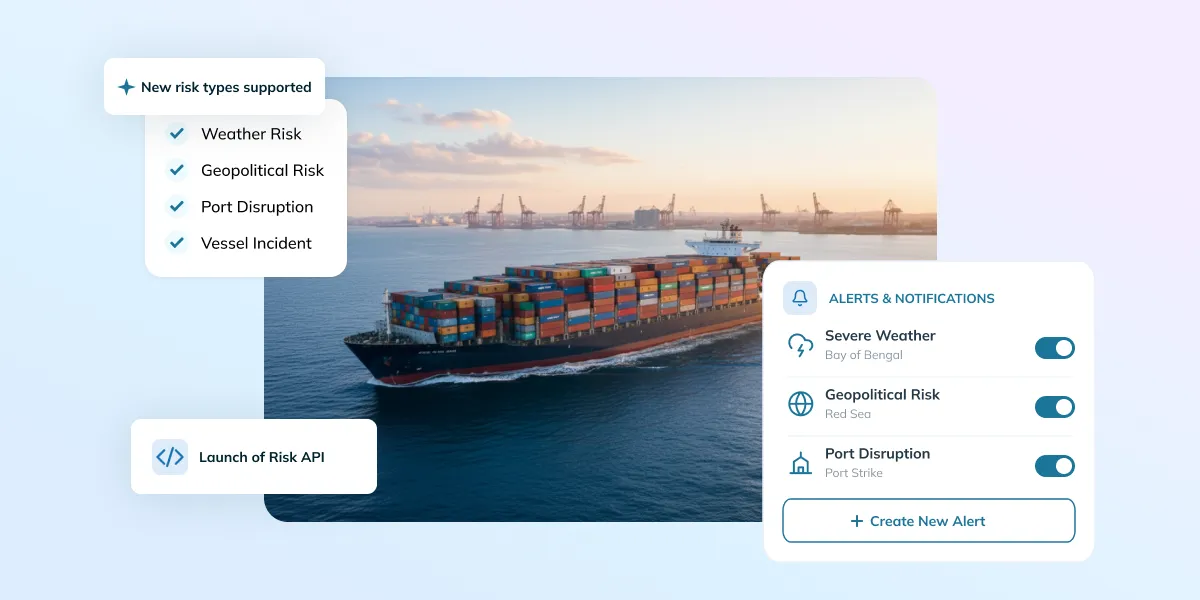
Using the live vessel positioning, which takes into account all the vessels at the port using the destination port prediction engine, which includes:
- ETAs of vessels scheduled to sail via the port
- Live AIS data of vessels currently at the port or waiting at anchorage
This provides a more accurate forward-looking representation of the situation at the port, allowing shippers to better plan pick up slots and organize the warehouse space.
Our approach to analyzing port congestion
Portcast uses Live Median Vessel Wait Time as the main indicator to create a forward-looking representation of levels of congestion at a given port. Similarly, when calculating vessel and container ETAs, our machine learning algorithms take into consideration congestion at all the ports throughout the voyage, providing a more accurate timeline for the journey.
You can learn more about port congestion impact on shipping in the video recording of presentation by our COO, Shailesh Gupta:
Interested to learn more about how our solutions can be tailored to your business? Feel book a meeting with us.