Make Data-Driven Planning Decisions: KPI Dashboard
Portcast’s Logistics KPI Dashboard turns completed voyage data into actionable insights. Improve performance, reduce costs, and make better procurement decisions backed by supply chain analytics
Get Started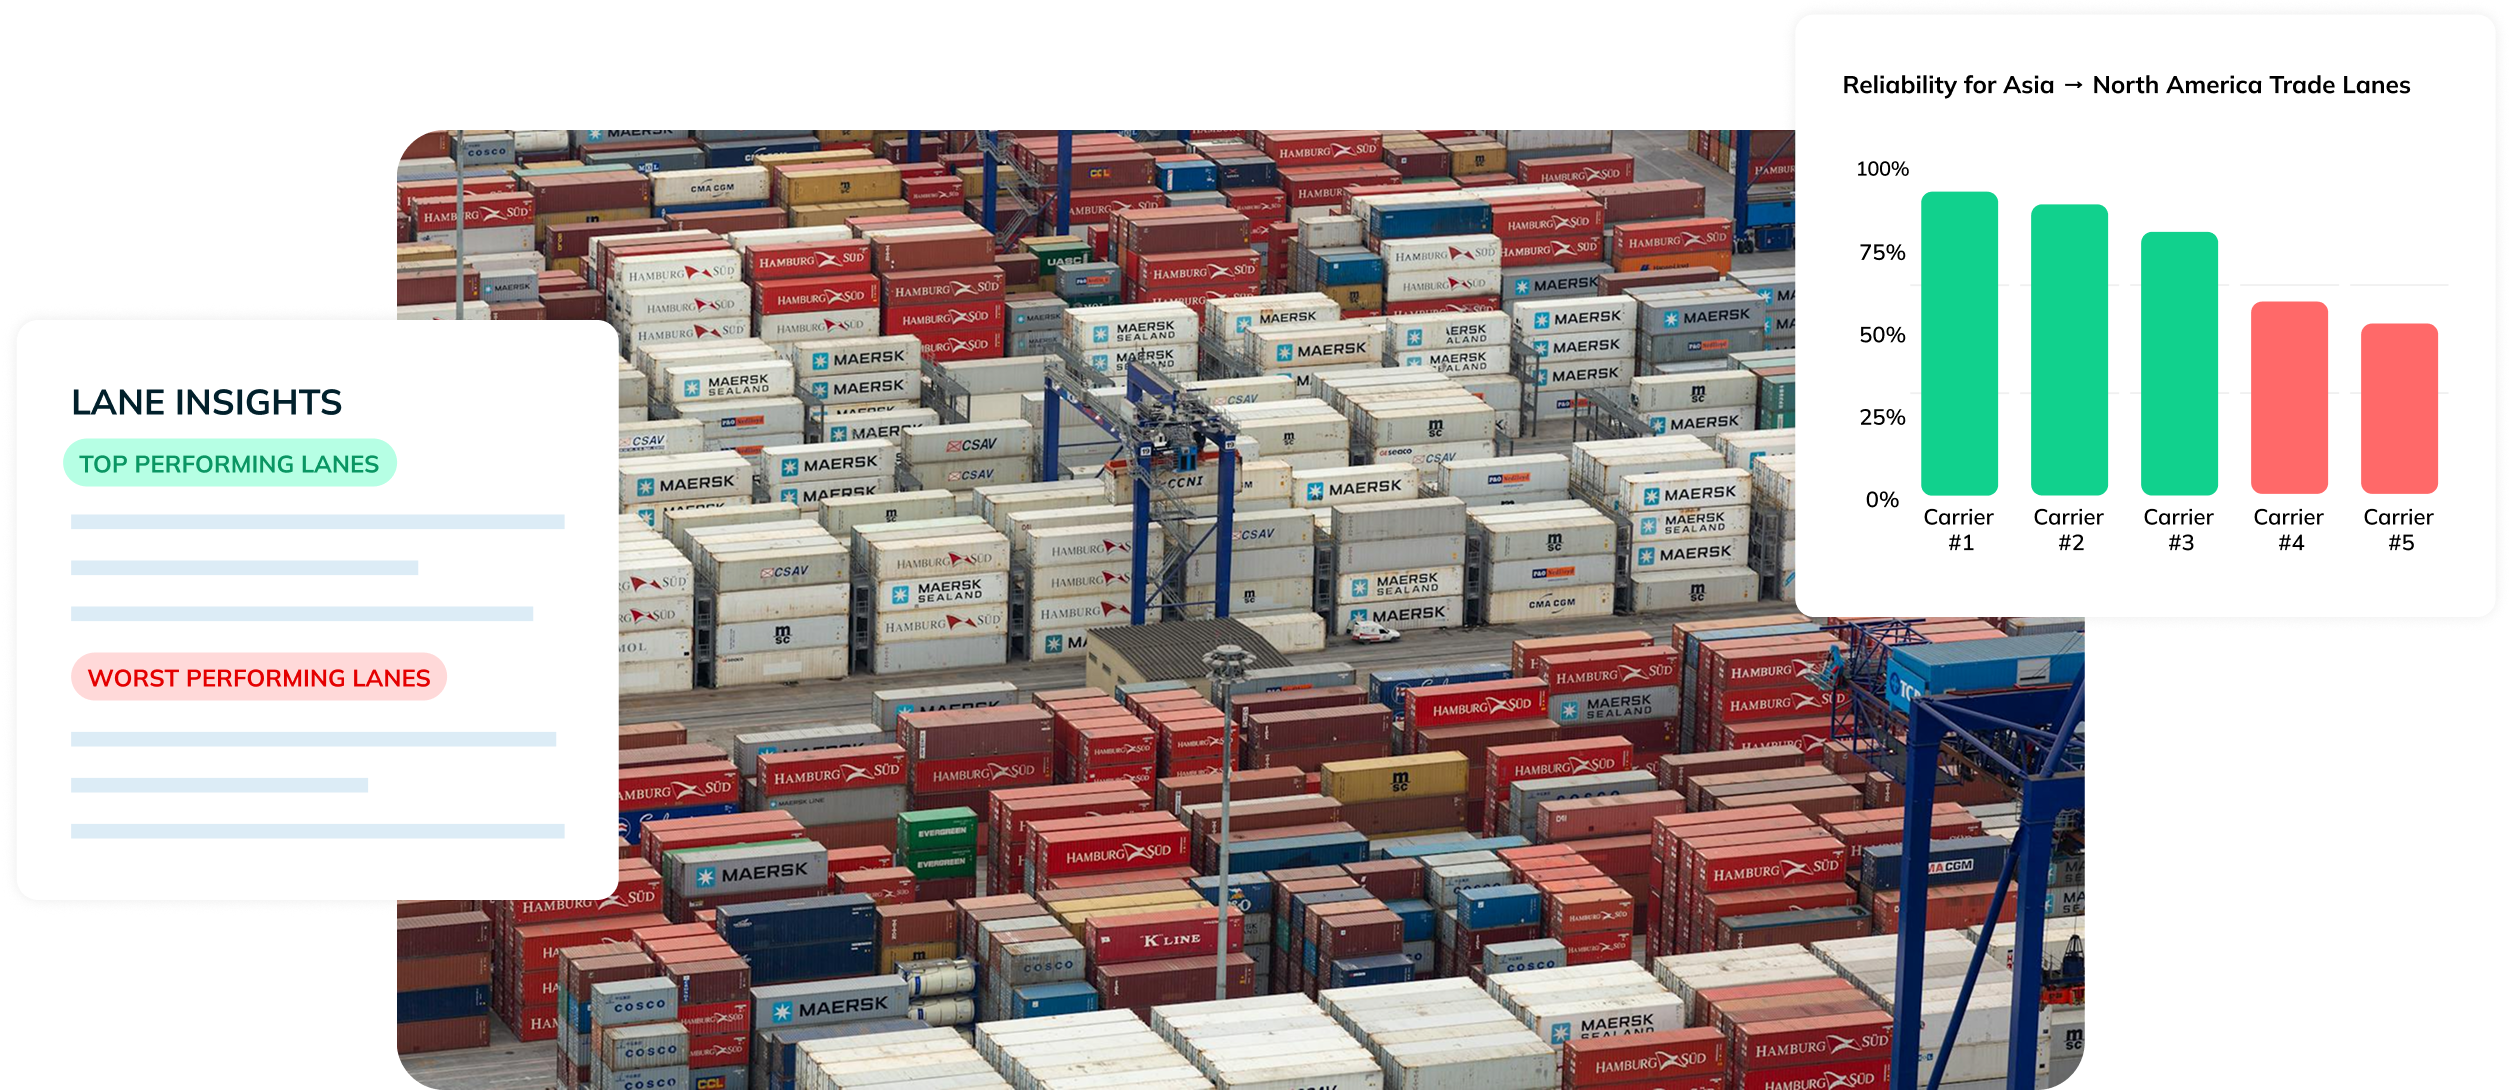
Benefits of Portcast’s Supply Chain Analytics Software

Improve Supply Chain Performance

Reduce Freight Costs

Support Procurement Planning


Key Features of Portcast's Supply Chain KPI Dashboard
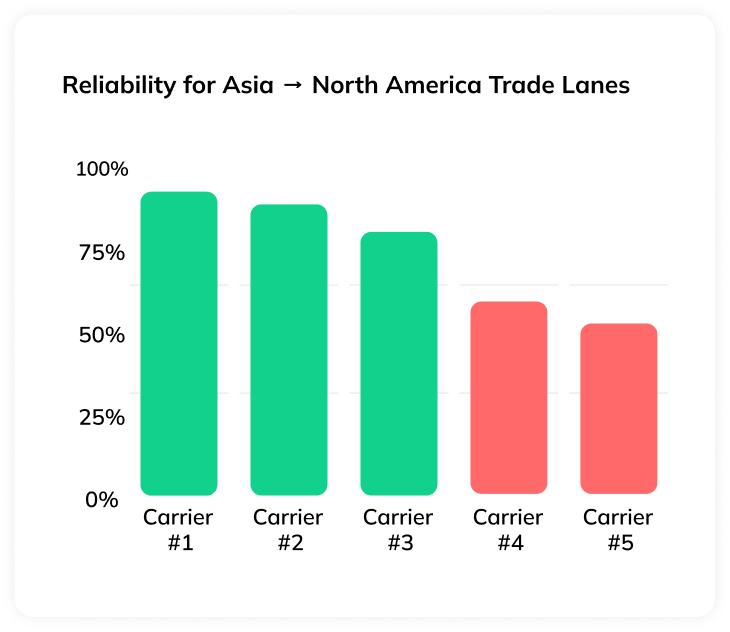
Carrier Performance Insights

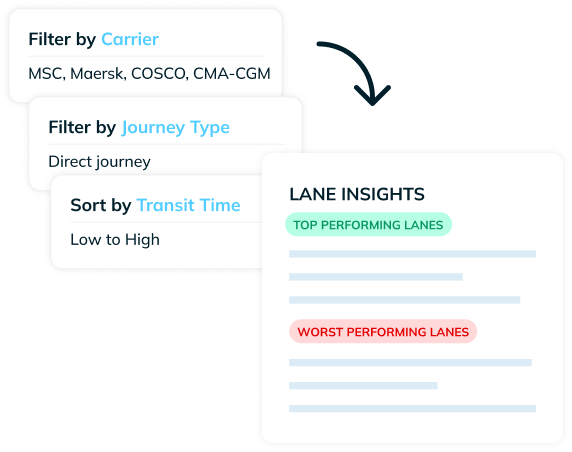
Network Performance Insights
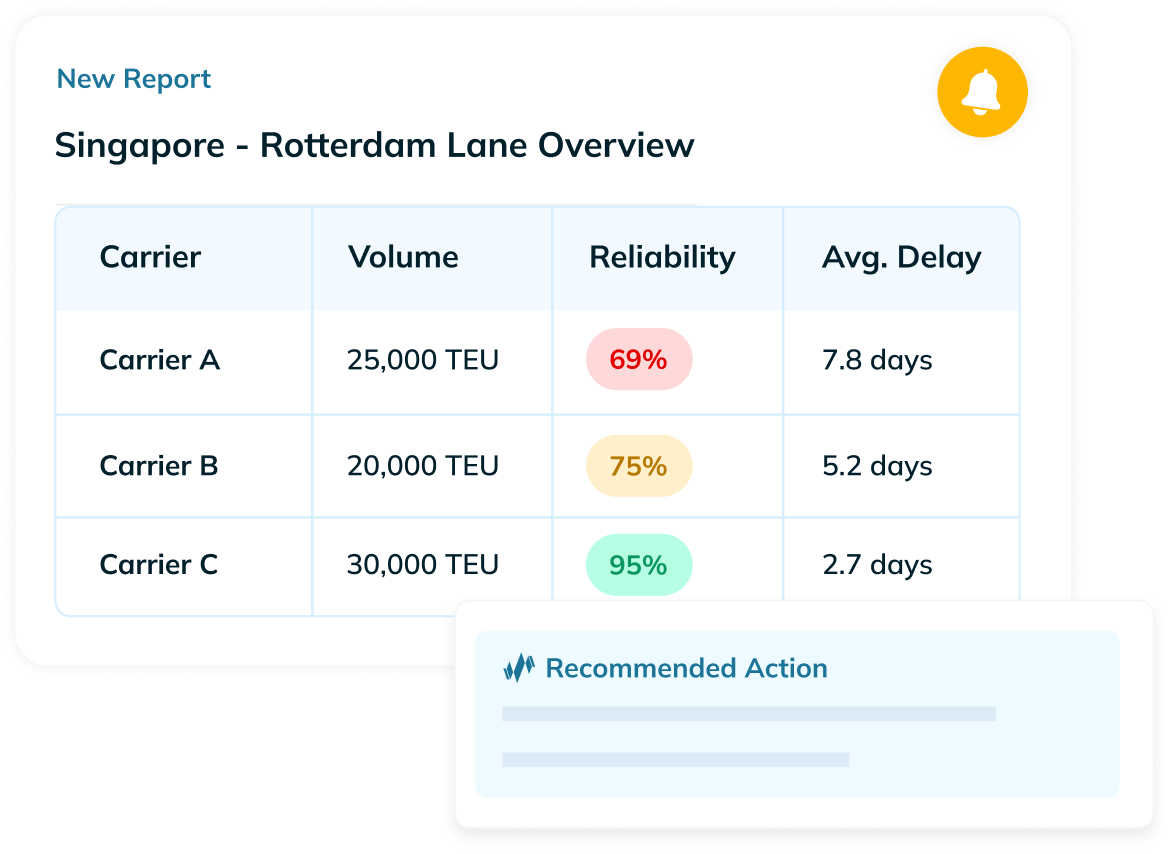
Intelligence for Decision-Making
Let’s talk!
We are here to help you make your supply chains efficient, enabled by reliable data.


How it works
Connect Your Shipping Data


Analyze Performance Automatically

Review and Resolve

KPI Dashboard:
Frequently Asked Questions
What is KPI Dashboard and how does it work?
KPI Dashboard is a supply chain analytics platform that analyzes historical shipment data tomeasure carrier performance and identify bottlenecks. It compares actual transit times against planned schedules to show where your supply chain performs well and where improvements are needed.
How is KPI Dashboard different from Command Center?
What data powers KPI Dashboard?
KPI Dashboard uses your historical shipment records from Portcast's visibility platform or you can bring-your-own historical shipment data. It analyzes origins, destinations, carriers, transit times, and delays to calculate supply chain KPI metrics and reliability scores. The supply chain analytics help you understand patterns across your network.
Which teams can use KPI Dashboard?
KPI Dashboard is designed for logistics, operations, and procurement teams involved in carrier selection and contract negotiations. It provides the performance data needed to make informed decisions during procurement cycles.
How is Portcast's KPI Dashboard different from other analytics tools?
Most analytics tools show what happened. Portcast's supply chain analytics software goes further by comparing carriers head-to-head, identifying root causes at the carrier, lane, and port level, and providing actionable data for procurement decisions.
Get Started with Portcast’s Supply Chain Analytics


