Portcast Insights
Sreelakshmi H K
January 26, 2026
2
Min
Read

Port Congestion Snapshot: Live Vessel Wait Times (Updated Weekly)

Get weekly port congestion insights across 100+ major global ports to monitor delays, assess congestion levels, and drive proactive planning with reliable data.
Port Congestion Snapshot: Live Vessel Wait Times (Updated Weekly)

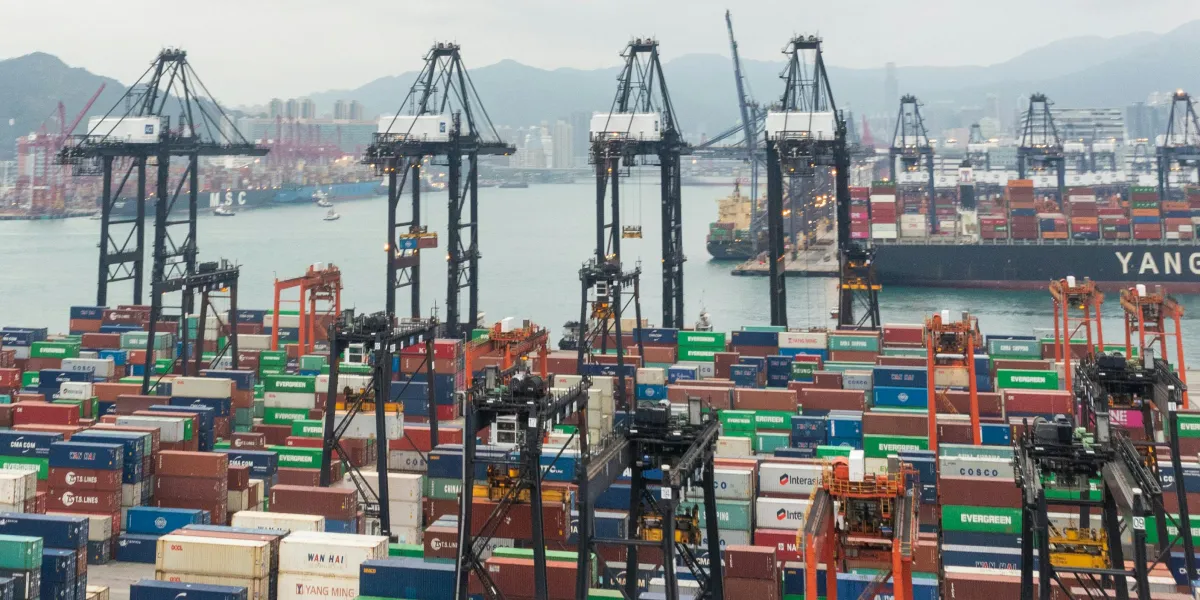
What is the current port congestion at major global ports?

Port congestion can shift quickly, impacting schedules, container dwell times, and customer commitments. To help supply chain teams stay ahead, this blog shares weekly congestion insights across 100+ major ports, updated every Monday.

How is port congestion calculated?

Portcast tracks congestion using real-time AIS signals, port call schedules, and predictive analytics. We calculate multiple congestion indices to give you a full picture:
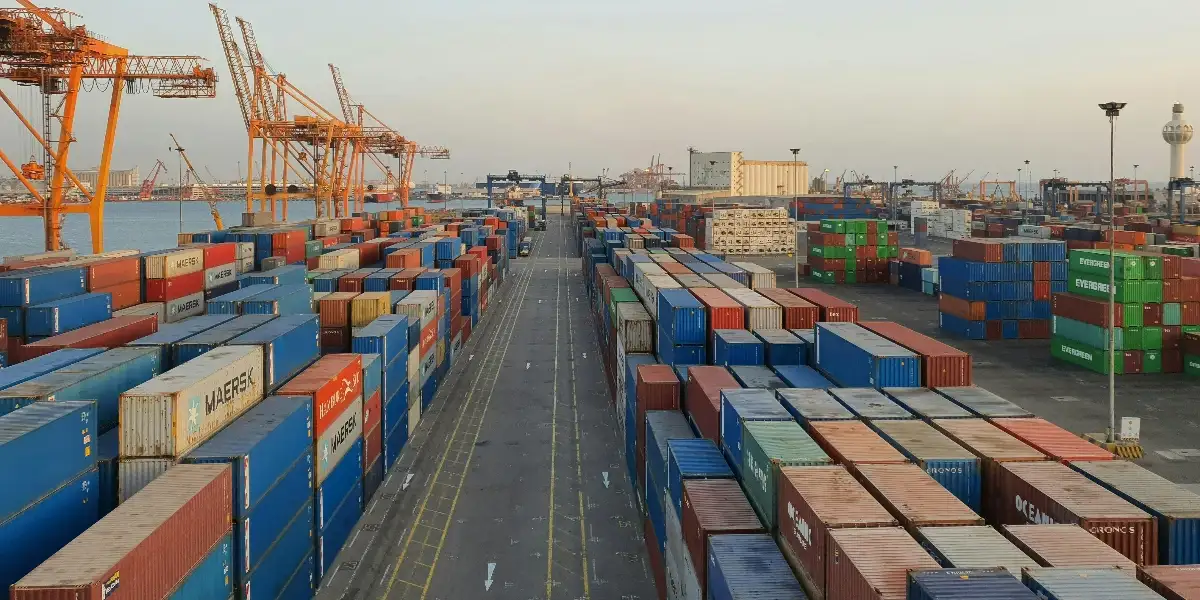
Index Definition Why It Matters
Median Wait Time (P50) The midpoint of all vessel wait times at a port Shows the typical experience for most vessels
75th Percentile (P75) 75% of vessels wait this long or less Highlights rising delays and operational pressure
90th Percentile (P90) 90% of vessels wait this long or less Captures extreme congestion and long tail events
Vessels Waiting Number of vessels currently at anchorage Reflects immediate backlog
Long Tail Congestion Indexed flag for outlier delays Signals unpredictability or port-level disruptions
Congestion Category Low / Medium / High (based on percentile thresholds) Simplifies planning and benchmarking

Live port congestion data – Week: 18 - 24 Jan 2026

The table below shows the latest congestion metrics for over 100 major global ports. This selection is based on the volume of containers approaching each port and is sorted alphabetically (by port code) for easy reference.

Port Code Port Name Port Country Week Median Waiting Time (in Days) 75th Percentile Waiting Time (in Days) 90th Percentile Waiting Time (in Days) Avg. Vessel waiting per day at Anchorage Long Tail Congestion Congestion Category Absolute Change from Previous Week
AEJEA JEBEL ALI UNITED ARAB EMIRATES (THE) 2026-01-18 - 2026-01-24 0.25 0.82 2.61 14 No low -0.10
AEKHL KHALIFA UNITED ARAB EMIRATES (THE) 2026-01-18 - 2026-01-24 0.52 0.99 1.60 2 No low 0.29
AUMEL MELBOURNE AUSTRALIA 2026-01-18 - 2026-01-24 0.40 0.94 1.64 2 No low 0.11
BDCGP CHITTAGONG BANGLADESH 2026-01-18 - 2026-01-24 0.91 1.29 2.12 5 No low -0.05
BEANR ANTWERP BELGIUM 2026-01-18 - 2026-01-24 0.13 1.04 2.46 9 Yes low -0.15
BRPNG PARANAGUA BRAZIL 2026-01-18 - 2026-01-24 0.83 1.44 2.73 4 No low 0.58
BRRIG RIO GRANDE BRAZIL 2026-01-18 - 2026-01-24 0.79 1.62 2.38 3 No low 0.57
BRRIO RIO DE JANEIRO BRAZIL 2026-01-18 - 2026-01-24 0.17 0.27 0.68 2 No low 0.03
BRSSZ SANTOS BRAZIL 2026-01-18 - 2026-01-24 0.58 1.42 2.84 7 No low -0.06
BSFPO FREEPORT BAHAMAS (THE) 2026-01-18 - 2026-01-24 1.33 2.66 4.14 5 No medium 0.38
CGPNR POINTE NOIRE CONGO (THE) 2026-01-18 - 2026-01-24 0.90 2.71 6.18 4 No low -2.18
CIABJ ABIDJAN CÔTE D'IVOIRE 2026-01-18 - 2026-01-24 1.13 2.19 4.84 4 No medium 0.33
CNDLC DALIAN CHINA 2026-01-18 - 2026-01-24 0.21 0.56 1.16 4 No low 0.00
CNLYG LIANYUNGANG CHINA 2026-01-18 - 2026-01-24 0.17 0.64 2.41 2 Yes low -0.08
CNNBG NINGBO CHINA 2026-01-18 - 2026-01-24 0.30 1.35 2.51 45 No low -0.67
CNNSA NANSHA CHINA 2026-01-18 - 2026-01-24 0.93 1.99 2.46 24 No low 0.29
CNQDG QINGDAO CHINA 2026-01-18 - 2026-01-24 0.71 1.56 2.09 27 No low 0.32
CNSHG SHANGHAI CHINA 2026-01-18 - 2026-01-24 0.54 1.58 2.72 68 No low -0.21
CNSHK SHEKOU CHINA 2026-01-18 - 2026-01-24 0.09 0.31 0.64 9 No low -0.04
CNSZX SHENZHEN CHINA 2026-01-18 - 2026-01-24 0.17 0.75 1.03 0 No low 0.08
CNTAG TAICANG CHINA 2026-01-18 - 2026-01-24 0.15 0.53 0.84 1 No low 0.11
CNTXG TIANJIN XINGANG CHINA 2026-01-18 - 2026-01-24 0.04 0.33 1.08 2 Yes low 0.00
CNXMG XIAMEN CHINA 2026-01-18 - 2026-01-24 0.08 0.17 0.30 7 No low -0.05
CNYTN YANTIAN CHINA 2026-01-18 - 2026-01-24 0.08 0.26 0.48 4 No low 0.00
CNZOS ZHOUSHAN CHINA 2026-01-18 - 2026-01-24 0.45 1.08 4.26 8 Yes low 0.35
COCTG CARTAGENA COLOMBIA 2026-01-18 - 2026-01-24 0.31 0.70 1.63 6 No low -0.16
DEBRV BREMERHAVEN GERMANY 2026-01-18 - 2026-01-24 0.04 0.38 1.17 5 No low -0.19
DEHAM HAMBURG GERMANY 2026-01-18 - 2026-01-24 0.13 1.00 5.86 11 Yes low -0.16
DOCAU CAUCEDO DOMINICAN REPUBLIC (THE) 2026-01-18 - 2026-01-24 0.22 0.44 1.17 3 No low 0.09
DZALG ALGER ALGERIA 2026-01-18 - 2026-01-24 5.49 7.87 10.05 5 No high 1.70
EGALY ALEXANDRIA EGYPT 2026-01-18 - 2026-01-24 1.28 2.54 2.95 3 No medium -0.09
EGDAM DAMIETTA EGYPT 2026-01-18 - 2026-01-24 0.79 1.55 2.83 6 No low 0.12
EGEDK EL DEKHEILA EGYPT 2026-01-18 - 2026-01-24 0.55 1.06 1.30 4 No low -0.19
EGPSD PORT SAID EGYPT 2026-01-18 - 2026-01-24 0.41 0.78 1.98 3 No low 0.18
ESALG ALGECIRAS SPAIN 2026-01-18 - 2026-01-24 0.67 1.55 3.18 8 No low -0.04
ESBCN BARCELONA SPAIN 2026-01-18 - 2026-01-24 0.35 0.83 1.37 2 No low -0.07
ESLPA LAS PALMAS SPAIN 2026-01-18 - 2026-01-24 0.08 0.26 0.67 2 Yes low -0.03
ESVLC VALENCIA SPAIN 2026-01-18 - 2026-01-24 0.19 0.67 1.43 4 No low 0.15
FRLEH LE HAVRE FRANCE 2026-01-18 - 2026-01-24 0.25 2.06 3.12 7 No low 0.21
GBLGP THAMES UNITED KINGDOM OF GREAT BRITAIN AND NORTHERN IRELAND (THE) 2026-01-18 - 2026-01-24 0.38 1.21 1.98 4 No low -0.20
GBSOU SOUTHAMPTON UNITED KINGDOM OF GREAT BRITAIN AND NORTHERN IRELAND (THE) 2026-01-18 - 2026-01-24 0.63 1.50 3.26 3 No low 0.42
GHTEM TEMA GHANA 2026-01-18 - 2026-01-24 2.42 4.17 6.26 11 No medium -0.40
GNCKY CONAKRY GUINEA 2026-01-18 - 2026-01-24 10.34 15.22 22.84 6 No high -2.78
GRPIR PIRAEUS GREECE 2026-01-18 - 2026-01-24 0.44 0.83 1.34 5 No low -0.93
HKHKG HONG KONG HONG KONG 2026-01-18 - 2026-01-24 0.08 0.23 0.71 12 No low 0.04
HNPCR PUERTO CORTES HONDURAS 2026-01-18 - 2026-01-24 0.63 1.24 1.83 2 No low 0.37
IDJKT JAKARTA INDONESIA 2026-01-18 - 2026-01-24 0.50 1.12 2.15 7 No low 0.24
IDSRG SEMARANG INDONESIA 2026-01-18 - 2026-01-24 1.71 2.75 4.45 8 No medium 0.37
IDSUB SURABAYA INDONESIA 2026-01-18 - 2026-01-24 0.70 1.56 3.47 13 No low -0.28
ILASH ASHDOD ISRAEL 2026-01-18 - 2026-01-24 0.98 2.08 3.22 5 No low -0.22
INCCU KOLKATA INDIA 2026-01-18 - 2026-01-24 1.58 3.31 4.67 4 No medium 0.34
INMUN MUNDRA INDIA 2026-01-18 - 2026-01-24 0.26 0.61 1.24 4 No low -0.27
INNSA NHAVA SHEVA INDIA 2026-01-18 - 2026-01-24 0.15 0.39 0.76 2 No low 0.04
ITGIT GIOIA TAURO ITALY 2026-01-18 - 2026-01-24 0.87 2.33 3.05 5 No low 0.83
JMKIN KINGSTON JAMAICA 2026-01-18 - 2026-01-24 0.17 0.43 2.83 2 No low -0.18
JPHKT HAKATA JAPAN 2026-01-18 - 2026-01-24 0.09 0.21 0.76 2 No low -0.17
JPNGO NAGOYA JAPAN 2026-01-18 - 2026-01-24 0.04 0.19 0.32 3 No low 0.00
JPOSA OSAKA JAPAN 2026-01-18 - 2026-01-24 0.04 0.04 0.33 2 No low 0.00
JPTYO TOKYO JAPAN 2026-01-18 - 2026-01-24 0.04 0.32 0.67 2 No low -0.06
JPUKB KOBE JAPAN 2026-01-18 - 2026-01-24 0.04 0.08 0.25 1 No low 0.00
JPYOK YOKOHAMA JAPAN 2026-01-18 - 2026-01-24 0.08 0.28 0.66 3 No low 0.01
KEMBA MOMBASA KENYA 2026-01-18 - 2026-01-24 5.57 10.67 14.69 14 No high -1.30
KRCHF JINHAE KOREA (THE REPUBLIC OF) 2026-01-18 - 2026-01-24 0.08 0.19 1.31 0 Yes low -0.03
KRPUS BUSAN KOREA (THE REPUBLIC OF) 2026-01-18 - 2026-01-24 0.08 0.18 0.55 9 No low 0.00
LKCMB COLOMBO SRI LANKA 2026-01-18 - 2026-01-24 0.50 1.13 1.57 11 No low -0.04
MACAS CASABLANCA MOROCCO 2026-01-18 - 2026-01-24 5.92 6.69 7.29 6 No high 3.09
MAPTM TANGER MED MOROCCO 2026-01-18 - 2026-01-24 0.78 1.95 3.96 23 No low 0.48
MTMAR MARSAXLOKK MALTA 2026-01-18 - 2026-01-24 1.74 2.69 3.83 4 No medium 0.76
MUPLU PORT LOUIS MAURITIUS 2026-01-18 - 2026-01-24 0.57 2.31 4.90 6 No low -1.18
MXVER VERACRUZ MEXICO 2026-01-18 - 2026-01-24 1.17 1.63 2.58 3 No medium -0.45
MXZLO MANZANILLO MEXICO 2026-01-18 - 2026-01-24 0.15 0.45 0.87 1 No low 0.01
MYPKG PORT KLANG MALAYSIA 2026-01-18 - 2026-01-24 0.34 1.15 2.17 11 No low -0.50
MYTPP TANJUNG PELEPAS MALAYSIA 2026-01-18 - 2026-01-24 0.29 0.79 1.10 14 No low 0.08
MZBEW BEIRA MOZAMBIQUE 2026-01-18 - 2026-01-24 20.96 23.40 23.92 12 No high 6.25
NLRTM ROTTERDAM NETHERLANDS (THE) 2026-01-18 - 2026-01-24 0.12 0.64 1.50 10 No low -0.36
NLWAL ROTTERDAM WAALHAVEN NETHERLANDS (THE) 2026-01-18 - 2026-01-24 0.04 0.08 0.17 0 No low 0.00
PAMIT MANZANILLO PANAMA 2026-01-18 - 2026-01-24 0.33 1.02 2.56 5 No low -0.05
PAROD RODMAN PANAMA 2026-01-18 - 2026-01-24 1.00 1.65 1.97 5 No medium 0.25
PECLL CALLAO PERU 2026-01-18 - 2026-01-24 0.19 0.46 1.04 1 No low 0.01
PHMNL MANILA PHILIPPINES (THE) 2026-01-18 - 2026-01-24 1.83 2.85 4.09 17 No medium 0.79
PHMNS MANILA SOUTH HARBOR PHILIPPINES (THE) 2026-01-18 - 2026-01-24 5.47 6.29 9.02 5 No high -0.09
RUNVS NOVOROSSIYSK RUSSIAN FEDERATION (THE) 2026-01-18 - 2026-01-24 1.26 2.64 4.57 7 No medium 0.08
SAJED JEDDAH SAUDI ARABIA 2026-01-18 - 2026-01-24 0.12 0.25 0.65 1 Yes low -0.05
SGSIN SINGAPORE SINGAPORE 2026-01-18 - 2026-01-24 0.30 0.86 1.71 48 No low 0.13
TGLFW LOME TOGO 2026-01-18 - 2026-01-24 1.20 5.09 5.95 7 No medium -1.24
THBKK BANGKOK THAILAND 2026-01-18 - 2026-01-24 0.29 0.67 1.19 3 No low -0.09
THLCH LAEM CHABANG THAILAND 2026-01-18 - 2026-01-24 0.07 0.38 1.04 3 Yes low -0.04
TRAMR AMBARLI TURKEY 2026-01-18 - 2026-01-24 0.21 0.92 3.18 6 Yes low -0.67
TRMER MERSIN TURKEY 2026-01-18 - 2026-01-24 0.18 0.62 1.12 2 No low 0.06
TRTEK TEKIRDAG TURKEY 2026-01-18 - 2026-01-24 0.42 0.63 1.16 3 No low -0.28
TWKEL KEELUNG TAIWAN (PROVINCE OF CHINA) 2026-01-18 - 2026-01-24 0.08 0.32 0.78 3 Yes low -0.04
TWKHH KAOHSIUNG TAIWAN (PROVINCE OF CHINA) 2026-01-18 - 2026-01-24 0.04 0.17 0.61 4 No low 0.00
TWTPE TAIPEI TAIWAN (PROVINCE OF CHINA) 2026-01-18 - 2026-01-24 0.08 0.12 0.28 2 No low 0.03
TWTXG TAICHUNG TAIWAN (PROVINCE OF CHINA) 2026-01-18 - 2026-01-24 0.04 0.09 0.38 1 Yes low 0.00
TZDAR DAR ES SALAAM TANZANIA, UNITED REPUBLIC OF 2026-01-18 - 2026-01-24 3.33 8.56 14.31 9 No high -0.52
USNYC NEW YORK UNITED STATES OF AMERICA (THE) 2026-01-18 - 2026-01-24 0.09 0.92 1.42 2 No low -0.04
USORF NORFOLK UNITED STATES OF AMERICA (THE) 2026-01-18 - 2026-01-24 0.31 0.59 1.12 3 No low -0.03
USPEF PORT EVERGLADES UNITED STATES OF AMERICA (THE) 2026-01-18 - 2026-01-24 0.12 0.39 1.02 2 No low 0.08
USSAV SAVANNAH UNITED STATES OF AMERICA (THE) 2026-01-18 - 2026-01-24 0.69 2.16 3.57 7 No low -1.31
VNCMT CAI MEP VIET NAM 2026-01-18 - 2026-01-24 0.08 0.31 1.28 1 Yes low 0.00
VNHPH HAI PHONG VIET NAM 2026-01-18 - 2026-01-24 0.13 0.25 0.95 4 No low 0.01
VNSGN HO CHI MINH VIET NAM 2026-01-18 - 2026-01-24 0.09 0.29 0.90 13 No low -0.12
ZAZBA COEGA SOUTH AFRICA 2026-01-18 - 2026-01-24 0.63 5.04 7.63 4 No low -1.79

This weekly snapshot gives you a quick view of congestion across 100+ major ports. But Portcast customers get far more: They get real-time insights into terminal-level congestion, long-tail delays, and dynamic ETAs that adapt to changing port conditions. Instead of reacting to disruptions, they plan proactively — with one platform that flags issues early and helps teams stay ahead.

See How Port Congestion Affects Your Containers

Port congestion data is most powerful when it’s connected to your actual shipments. Our customers use Portcast to turn port congestion insights into proactive decisions that improve on-time delivery and reduce costs.

  • Get real-time visibility into congestion across 600+ seaports
  • Monitor vessel waiting times and traffic to manage disruptions
  • Plan effective shipping routes using updated weekly data

Check our live tracker or API.

Want to learn more? Contact us.

Frequently Asked Questions

1.  Why does a port show low congestion even though vessels are waiting?

This can happen when delays affect only a small number of vessels, a pattern known as long tail congestion. For example, most ships may move through quickly, but a few face extended waits due to berth bunching, yard handling bottlenecks, or customs clearance. These isolated delays don't raise the overall congestion level but can still cause significant supply chain disruption.

2. What does it mean when congestion is ‘high’ but wait times look normal?

This usually signals operational unpredictability. Some vessels may move fast, while others get stuck in long delays. We calculate not just median times but also P75 and P90 percentiles — these capture long-tail delays that disrupt planning.

3. What causes ‘long tail congestion’?

Long tail congestion occurs when a minority of vessels experience delays far beyond the average. Causes include berth bunching, high yard utilisation, equipment failures, adverse weather, or ripple effects from blank sailings. Even if most vessels move smoothly, these outliers can disrupt schedules and downstream operations.

4. Why do some vessels skip anchorage but still get delayed?

In ports like Shanghai or Singapore, vessels may be held offshore instead of queuing at anchorage, or they may face longer terminal processing after docking. So, skipping anchorage doesn’t always mean faster turnaround.

5. How is ‘vessel waiting time’ calculated at Portcast?

We calculate it from the moment a vessel reaches anchorage until it is successfully berthed. Our models combine AIS signals, live port calls, and historical trends to detect waiting — even when port status updates are delayed or unavailable.

6. Can vessel traffic be high even if congestion is low?

Yes. High traffic means a port is busy, but it doesn’t always mean it’s delayed. Efficient ports can handle large vessel volumes without long queues. That’s why we track both traffic and actual waiting times.

7. What’s the difference between ‘vessel traffic’ and ‘vessel waiting’?

Vessel waiting refers to ships anchored or drifting while pending berth availability. Vessel berthed means the ship has secured a berth and is undergoing unloading, loading, or other terminal processes. Tracking both provides a clearer view of how quickly a port moves ships from arrival to operational processing.

8. How does Portcast categorize congestion as low, medium, or high?

We benchmark each port using percentile-based thresholds:

  • Low: Below median (P50) wait time and consistent flows
  • Medium: Delays starting to rise; P75 trending up
  • High: Long tail cases; P90 or maximum delays breaching norms
  • This helps compare ports fairly across regions and trade lanes.

9. Why is ETA alone not reliable for congestion assessment?

ETAs are often optimistic or rarely updated. They don’t account for live vessel backlog, yard congestion, or real terminal delays. Our predictions use real-time vessel behavior, anchorage time, and processing trends — offering a clearer congestion signal.

10. Why don't carrier ETAs reflect actual port congestion or update in line with real-time congestion conditions?

Carrier ETAs are based on planned schedules and may not account for real-time congestion. Our congestion indices capture actual conditions — from anchorage arrival to terminal dwell — that carriers may not factor into their updates. For example, a vessel might arrive on time but wait two days at the terminal before unloading, which wouldn't be visible in the carrier's ETA.

11. Can I get this data for my own port list or trade routes?

Yes. Portcast’s API and Port Congestion Tracker let you monitor congestion metrics and vessel wait times for major global ports.

You can export it directly from the Port Congestion Tracker or access it via our API for TMS integration and planning your automation.

Want to go deeper with port congestion analytics?

Are you looking for reliable port congestion insights or to automate your workflows using this data?

You can visit our Port Congestion Tracker

Explore the API Documentation

Request a Demo

Conclusion

Subscribe to Our Newsletter
Stay up to date with a monthly digest of container shipping news and data insights by Portcast.