Close
Book a Meeting
OR
Please enter business email address (free email accounts are not allowed)
Fields with * are required
Thank you! Your submission has been received!
Oops! Something went wrong while submitting the form.
Close
Portcast Insights
Kostiantyn Bankovskyi
June 15, 2022
2
Min
Read

Container Dwell Time Analysis Report

This data marketing report by Portcast analyses the past, present and future movement of global sea freight. The metrics featured in this report are port congestion and container dwell times.
Container Dwell Time

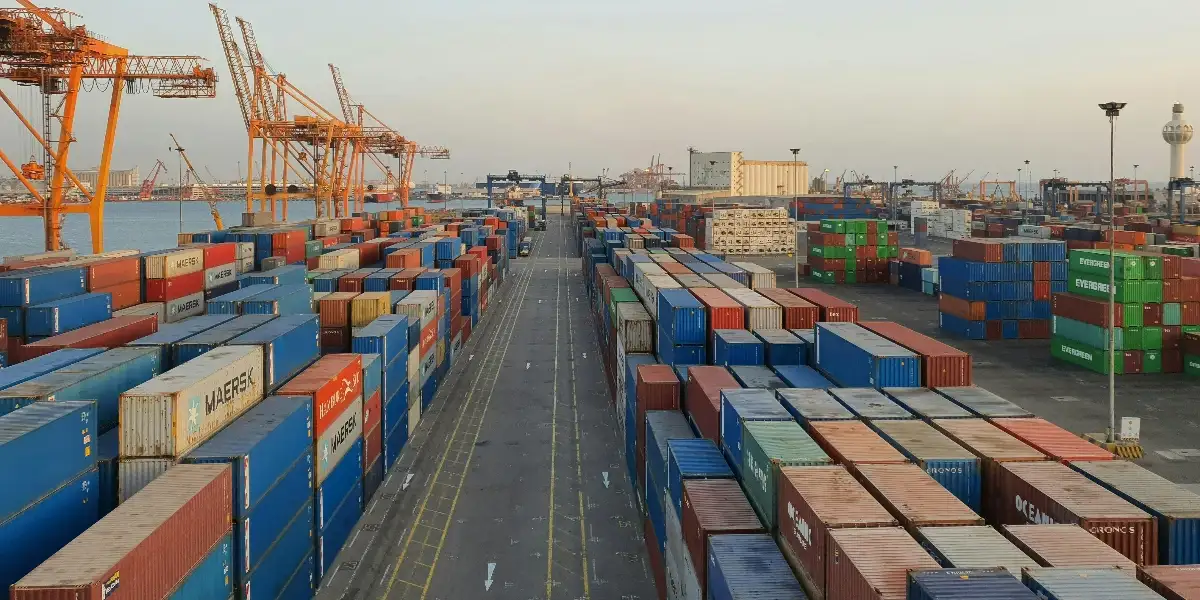
Let's start with stating a definition of container dwell time. It is the period that a container sits in the port area awaiting clearance and delivery in the case of imports and loading on the ship in the case of exports.

Import full container dwell times showed mixed results in March 2022 in various regions. US ports topped the list of ports that had a higher-than-average import container dwell time in March 2022 at 6.03 days. US EC and US WC ports showed a consistent increase in import dwell times compared to previous months.

The US’s top two container ports of LA and Long Beach showed an increase in import container dwell along with Savannah on the East Coast while Seattle, New York and Houston showed a good improvement in the clearing of import containers.

It must however be noted that the issue of import dwell time is quite complex and many factors influence these metrics. Truck shortage, truck driver shortage, fleet owners not sending trucks to markets where there are a lot of deadheads.

In the USA especially, many truckers have been diverted to depots 30-40 miles away to off-load empty containers without truckers receiving any compensation for returning empty from that distance wasting fuel and time.

In Europe, there was a higher than usual import dwell in March 2022 attributed to containers bound for Russia/Ukraine stuck in EU ports awaiting instructions considering the trade sanctions.

Full Import Container Dwell Time Graph - Regional
Full Import Container Dwell Time Graph by Region

Conclusion

Port conditions are yo-yo-ing across the globe. European ports which have been quite efficient all along due to partial or complete automation have been faring well with congestion although in terms of their standards it has been a rough ride for them as well with sporadic increases in port congestion and container dwell times. EU port performances have come under pressure in the last few months due to the backlog created by Ukrainian boxes stuck in the EU ports and the impact of this could be felt soon. Also, the COVID-19 situation in China remains a big unknown as the virus continues its spread across China impacting normal life as the Government battles to control the spread.

Here at Portcast, we provide real-time predictive shipping container visibility and many other types of data for the shipping industry. If you're interested how we may help your Supply Chain, get in touch with us to book a free demo.

Subscribe to Our Newsletter
Stay up to date with a monthly digest of container shipping news and data insights by Portcast.