.webp)
A Note Before You Begin
Over the past few years, one frustration pattern that comes up consistently in conversations with supply chain teams at food and beverage companies is "We didn't find out early enough". About delays, extra costs, and disruptions. It wasn't because they didn't have the data, nor because their team wasn't capable. But it was because the tools they relied on were built to show everything equally. When you're managing hundreds of active containers, that becomes the problem. When everything looks important, nothing is prioritised.
This guide is built around a simple idea: in F&B supply chains, the question isn't how much visibility you have, but whether you know it early enough to act.
The sections that follow are designed to help you evaluate that, whether you are assessing a new solution or rethinking the one you already use.
- Simão Oliveira, Technical Product Manager, Portcast
1. The F&B Supply Chain Is Different, and the Stakes Prove It
In most industries, a late shipment is an inconvenience. You reroute, you apologize, you recover. In food and beverage manufacturing, a late shipment can mean destroyed product, broken customer contracts, halted production lines, and write-offs that hit your P&L.
Consider this scenario. A container of perishable ingredients left your supplier three weeks ago. It is now sitting at a transshipment port, eleven days idle. Your visibility tool shows an estimated arrival in nine days. Your downstream customer requires a minimum of 7 days' remaining shelf life upon receipt. The product has a shelf life of 22 days from the date of production. Do the math: product integrity is already compromised before the vessel has even departed.
👉 The question that matters is not when it arrives. It is: when did your system first detect that this container was at risk?
If the answer is today, you didn't have a visibility problem. You had a timing problem. And in F&B, timing is the only problem that matters.
Why a Delay in F&B Is a Different Category of Problem
In F&B, a late shipment triggers a cascade of consequences that the delay alone does not fully explain.
The Product Freshness and Shelf-Life Clauses:
When a beverage manufacturer ships a product to a retailer or distributor, there is typically a minimum remaining shelf life guaranteed upon receipt. If a container arrives short of that threshold, the customer has the right to refuse it. This is a contract clause.
The product is destroyed, redirected to a secondary market at a reduced value, or sits in a warehouse while someone figures out what to do with it. None of those outcomes show up in your shipment delay statistics. They show up in your P&L.
The Customer SLA Cascade:
Late or uncertain arrivals create downstream operational disruption for your customer. They planned warehouse capacity around your ETA. Their production schedules depend on your ingredients arriving on time. If your delivery is late and they found out with 24 hours’ notice rather than 5 days, you have made them less able to serve their own customers. That is a relationship problem, and a costly one.
The F&B companies that maintain the strongest customer relationships are often the ones whose customers know early enough to adjust, regardless of whether the delay was avoided.
The Stock-Out Risk:
For manufacturers that depend on imported ingredients, a delayed shipment can halt a production line. Depending on the ingredient, there may be no local alternative at short notice. The cost is idle production capacity, emergency procurement, and downstream orders that could not be fulfilled.
👉 The common thread is that, in each of these scenarios, the cost depends on how late detection occurs. The earlier you know, the more options you have. Options are what prevent write-offs, rejected shipments, and broken customer commitments.
2. Why Most Visibility Tools Fail
Before evaluating any tool, it helps to be honest about what current operations actually look like for most F&B supply chain teams.
The typical picture: a logistics team tracking 200 to 500 active containers at any given time. Carrier portals, a TMS, and possibly a third-party tracking layer. No automated prioritization. Alerts that fire for everything mean they are effectively alerts for nothing. A small team spends a disproportionate amount of time manually checking which containers are at risk, reacting to problems after they surface, and managing the operational fallout.
The Alert Fatigue Problem
This is a failure of the tools, not the team. The tools are designed for the average case: they tell you where everything is and when it will arrive. The F&B reality is that the average case requires no attention. The exceptions drive the cost, and they are buried in the noise.
When everything generates an alert, teams stop acting on alerts. The containers most in need of intervention are the least likely to receive it.
Most visibility platforms were not built for exception-first operations. They were built for visibility-as-completeness: show every container, every status, every update. This design philosophy works in industries where delays are scheduling problems. In F&B, it creates operational paralysis.
👉 The right frame is prioritization. F&B operations teams do not need to see every container. They need to see, with enough lead time to act, the roughly 8% of containers that will create 80% of their operational risk.
ETA accuracy - Lagging vs. Leading Metrics
ETA accuracy, as the industry defines it, is a lagging metric. It measures how close a prediction was to the actual outcome at the end of the voyage. The value of a prediction is determined at the moment it is delivered, relative to how much time remains to act.
A tool that gives you a highly accurate ETA at day 17 of a 20-day voyage has told you almost nothing useful. A tool that flags a likely 6-day delay at day 3 has given you something you can operationalize. These are fundamentally different products.
👉 For F&B supply chain leaders, the relevant metric is lead time to act: how many days before a disruption became irreversible did your system surface it?
That is the number that determines whether you can reroute, communicate with your customer, adjust warehouse planning, or escalate to the carrier. An accuracy percentage measured at the point of arrival tells you nothing about any of those decisions.
The Data Problem Behind Late Predictions
Early exception detection is a data problem before it is an algorithm problem. A prediction can only be as early as the earliest signal that feeds it. Most visibility tools work with the same basic inputs: carrier milestone updates, AIS vessel data, and scheduled port calls. These are lagging signals. They tell you what has happened.
Detecting a risk at day 3 of a 20-day voyage requires a different class of signals. The platform must understand what should happen on this voyage based on the carrier service, the specific vessel, the transshipment routing, and the contracted schedule, and detect deviations before they become confirmed events.
3. What Early Detection Actually Requires
Building a genuinely predictive visibility capability requires a different stack of signals, ones that reach far enough upstream to surface a problem before it has materialized into an irreversible delay. Here are the signal categories that separate early detection from reactive monitoring.
The Signals That Make Early Detection Possible
Each signal alone is partial. Together, they allow the platform to build a voyage-level risk picture that updates in real time as new events emerge. This compounding effect is what shifts detection from day 17 to day 3.
Detection Without Action Is Just Expensive Information
The operational value of early exception detection is only realized if it changes what your team does next. That requires the right containers surfaced to the right people at the right time.
The teams that get real value from predictive visibility are the ones whose tools automatically surface exceptions based on configurable risk thresholds for delay, idle time at transshipment, D&D exposure, and voyage events. The team sees the exceptions, not the full feed.
4. How Best-in-class Solutions Enable Exception-First Operations
If early detection is the goal, the next question is: what does a system need to do differently to actually enable it?
Across F&B supply chains, the platforms that deliver real operational value tend to share a common design principle: they are built for exception-first operations, not visibility as completeness.
Surfacing What Matters - Not Everything
In most tools, the default experience is a full list of shipments, with filters layered on top. In practice, this puts the burden on the user to constantly decide what to look at.
Best-in-class systems invert this model. They proactively surface the small subset of shipments that require attention, based on predefined risk thresholds such as:
- Delay likelihood
- Idle time at transshipment
- Risk of missing delivery windows
- Exposure to demurrage and detention (D&D)
Instead of scanning hundreds of containers, the team is presented with a prioritized view of exceptions. The operational question shifts from “what's happening?" to "what do we need to act on today?"
For F&B teams managing shelf-life constraints and tight SLAs, this prioritization is what enables earlier and more consistent intervention.
Case study - Exception-First Operations in Practice
One example of this model in action is the Portcast command center. In a typical deployment, a global shipper may be managing over 10,000 active containers at any given time. Rather than presenting a full shipment list, the Command Center surfaces only those that have crossed defined risk thresholds.
For instance:
- A subset of containers flagged as idle at transshipment ports, grouped by dwell time and severity
- Shipments identified as at risk of delay based on upstream signals
- Containers approaching D&D exposure, based on remaining free days
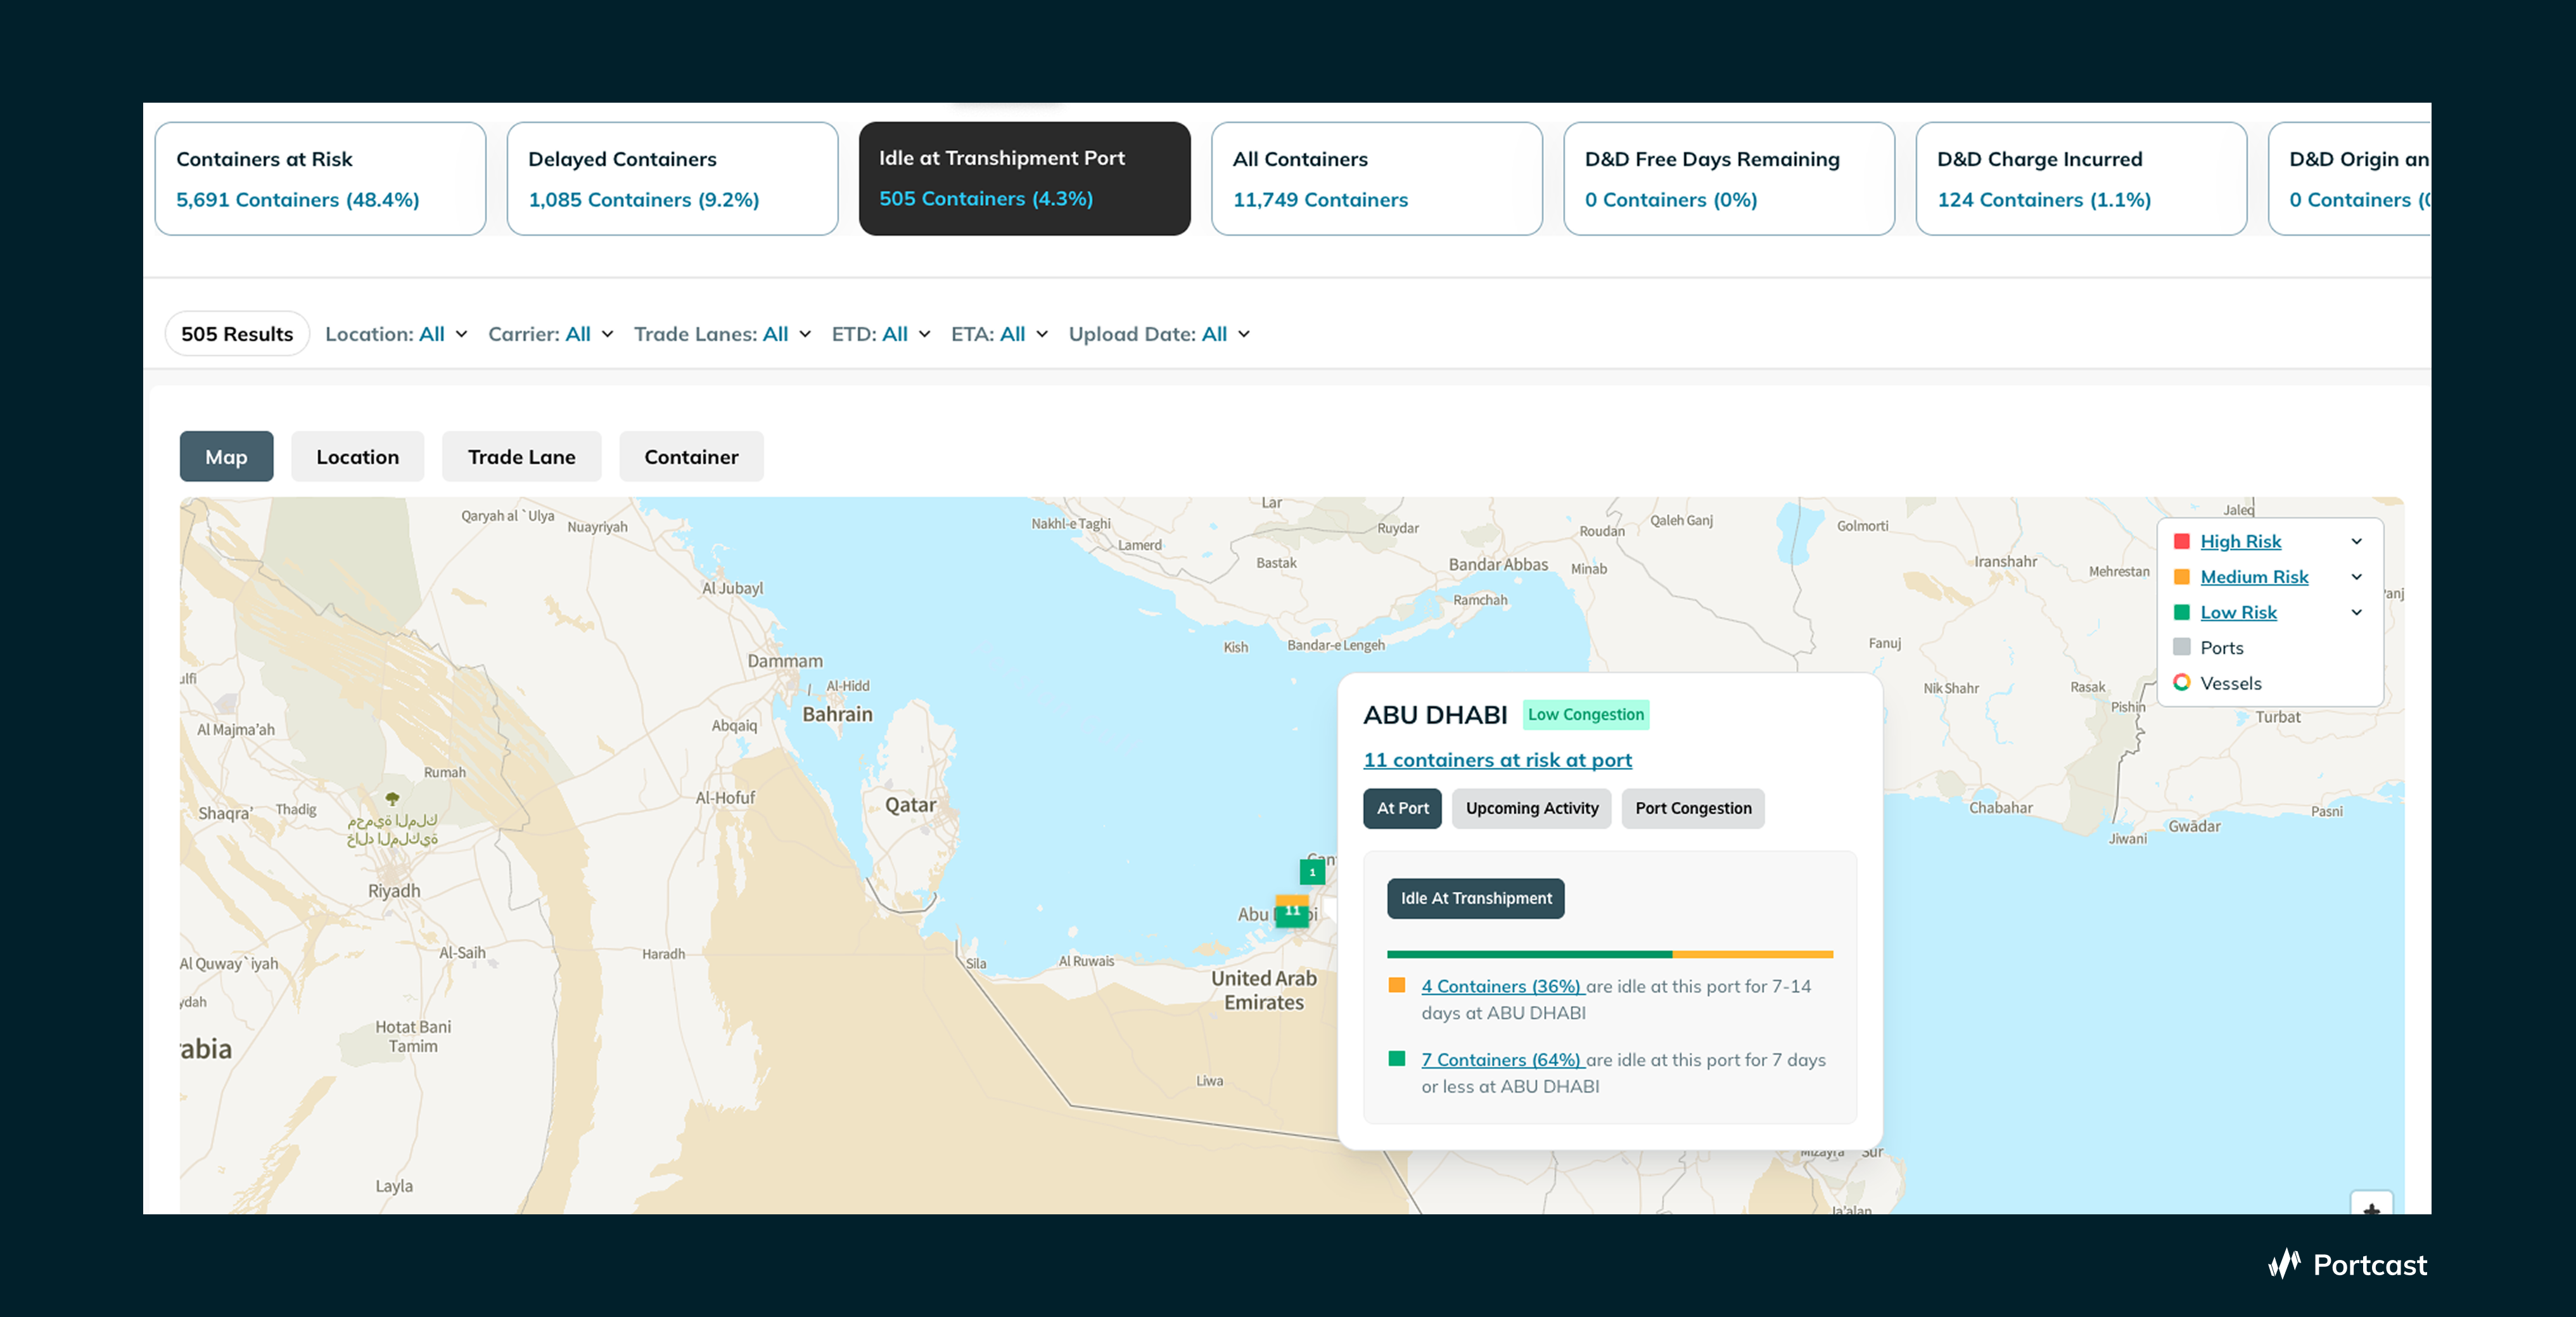
In the scenario displayed in the above screenshot, out of ~12,000 active containers:
- ~500 were surfaced as idle at transshipment
- ~5,000+ were flagged at risk in some form
The operational impact is immediate. Instead of manually scanning thousands of records, the team focuses only on the shipments that require intervention. More importantly, each exception is contextualized. A container is not just "delayed", it is delayed in a way that may:
- Breach a customer SLA
- Reduce remaining shelf life below acceptable thresholds
- Trigger additional costs if no action is taken
This is made possible by allowing team-specific thresholds of risk, fitting into the real operational challenges that are faced by the specific teams using tools like the Command Center. This combination of prioritization + context is what enables teams to move from monitoring to decision-making.
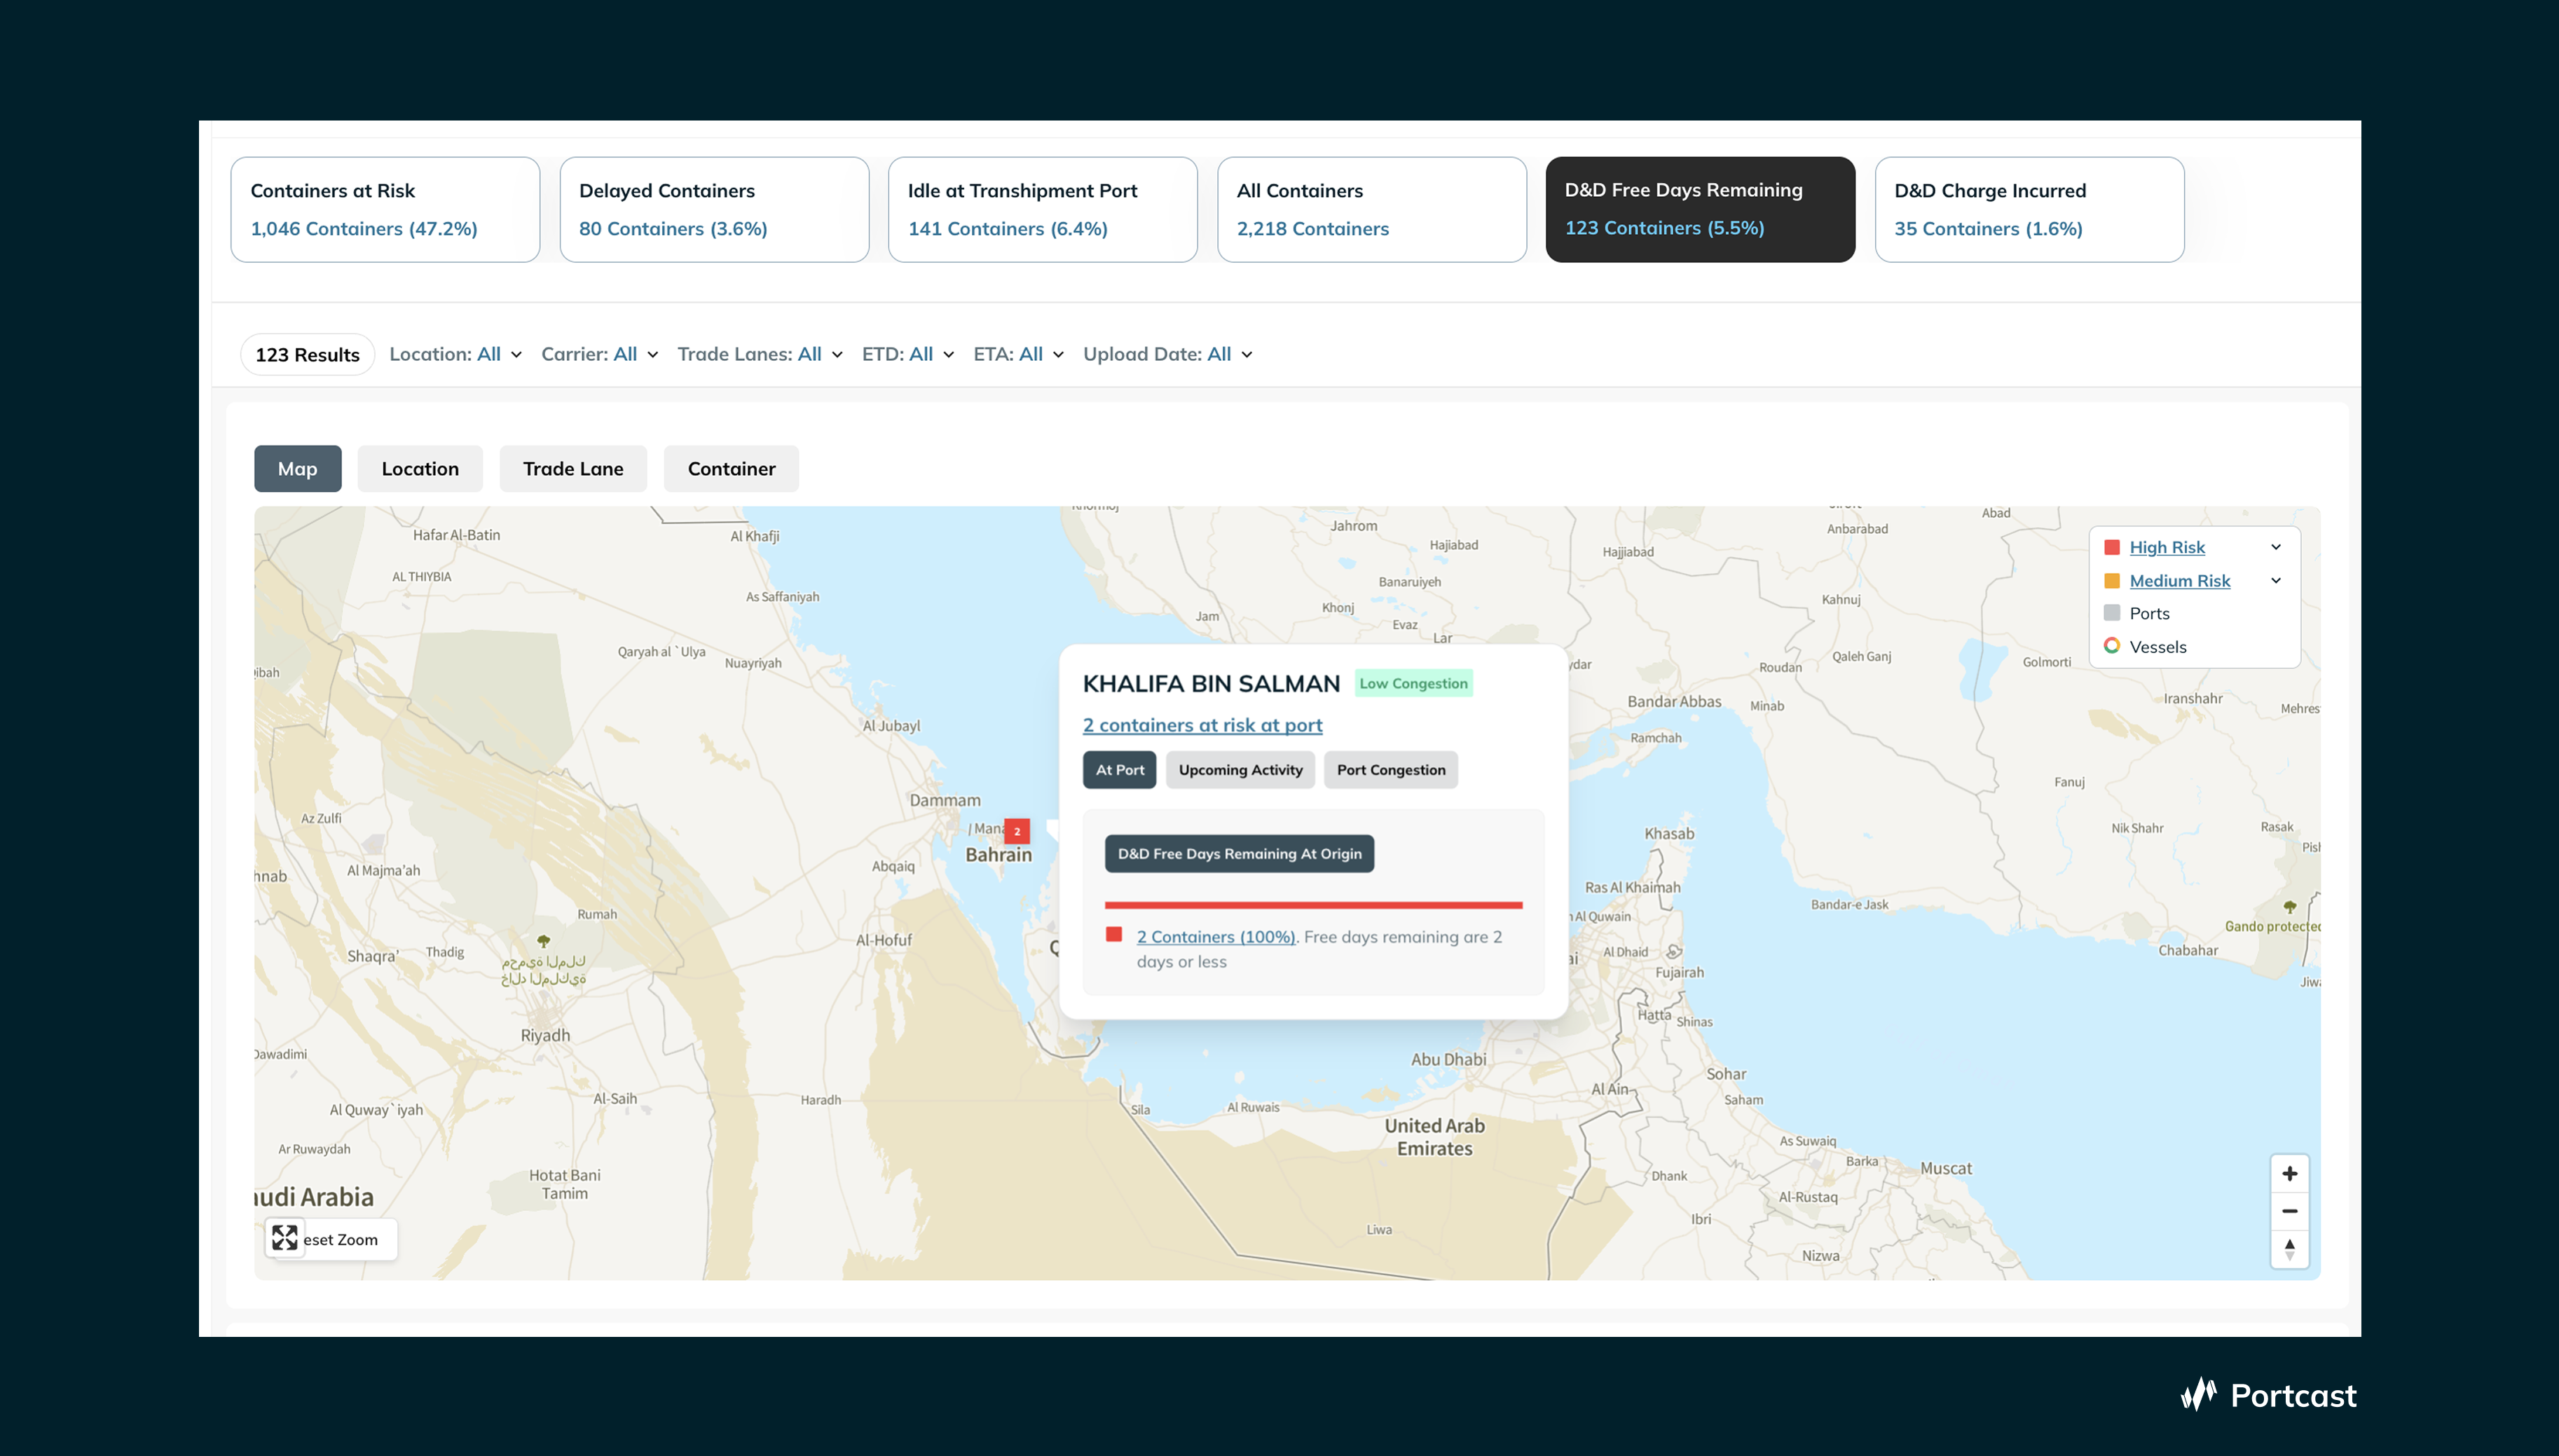
Proactive D&D Risk Surfacing
In F&B supply chains, delays do not just affect timing, they translate directly into cost.
One of the clearest examples is demurrage and detention. These charges are often treated as unavoidable costs, identified only when the invoice arrives.
Best-in-class systems treat them as a predictable, in-journey risk.
By tracking container-level free time against real-time port and vessel conditions, they can:
- Identify containers likely to exceed free days
- Surface them before charges are incurred
- Enable intervention (carrier escalation, pickup prioritization, planning adjustments)
The impact is not just the visibility of cost, but the prevention of it.
Integration Into Existing Workflows
A common failure mode for visibility tools is adoption.
If a platform requires teams to log in to a separate system and manually check for updates, it gradually becomes secondary to day-to-day operational tools like TMS or ERP systems.
The systems that deliver sustained value integrate directly into existing workflows:
- Alerts triggered within operational systems
- Data flowing into planning and execution tools
- Exceptions routed to the relevant teams automatically
The goal is not to create another dashboard, but to make existing processes earlier and more precise.
A System of Record for Performance
Beyond day-to-day operations, predictive visibility systems also create long-term value through the data they accumulate.
Over time, they build a structured record of how shipments actually perform across:
- Carriers
- Trade lanes
- Routes and transshipment patterns
This enables teams to move from anecdotal assessments to evidence-based decisions, particularly in procurement and carrier negotiations.
For F&B companies, where reliability directly affects product quality and customer commitments, this historical performance layer becomes a strategic asset rather than just an operational tool.
5. The Benefits of Doing It This Way
Operational: From Firefighting to Prioritized Action
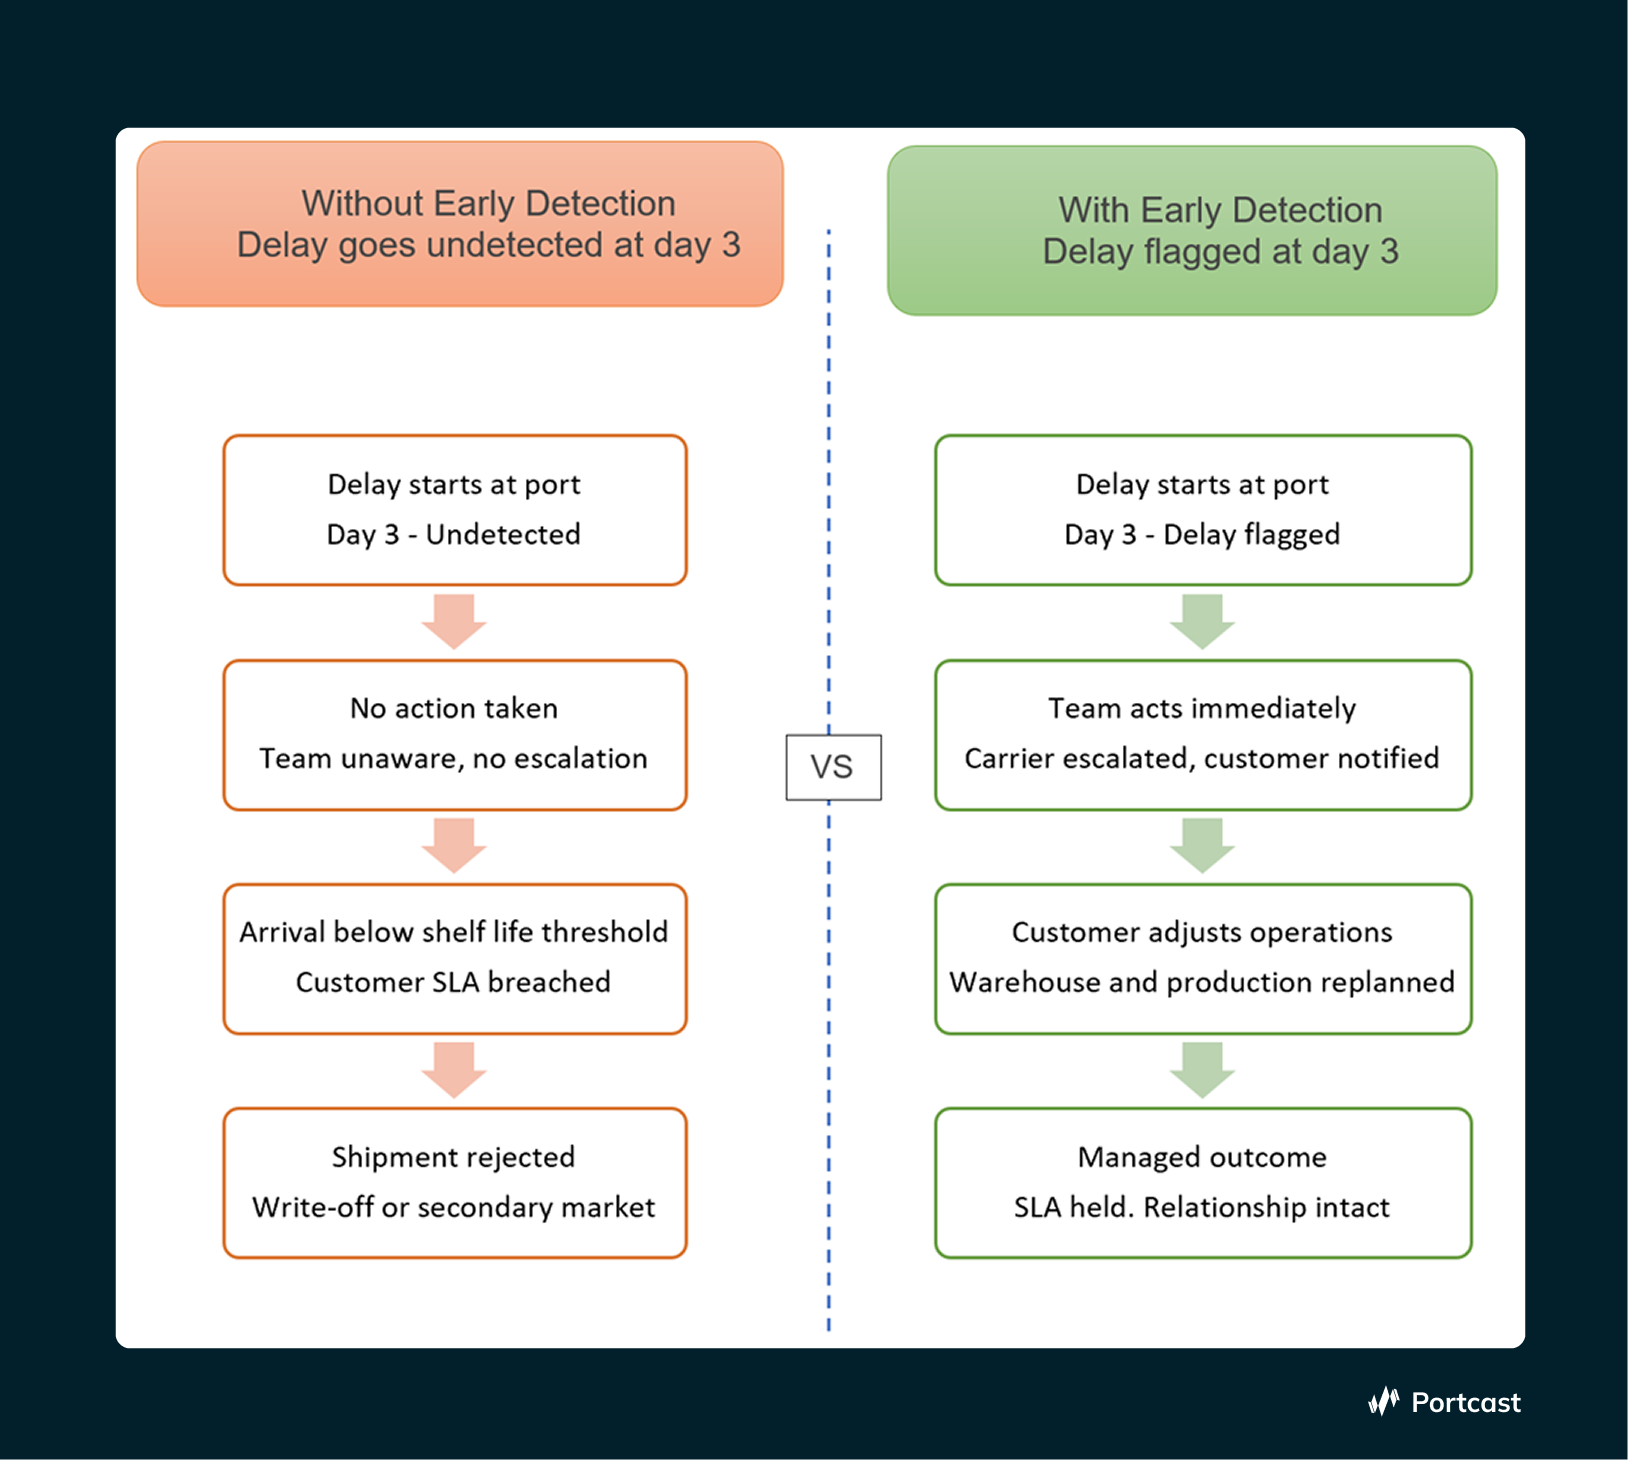
The most immediate benefit is the shift from reactive to proactive operations. Here is what that looks like in practice:
The teams that move from the left column to the right do not just recover more costs. They redirect significant human hours per week, previously spent on low-value tracking, toward higher-value work.
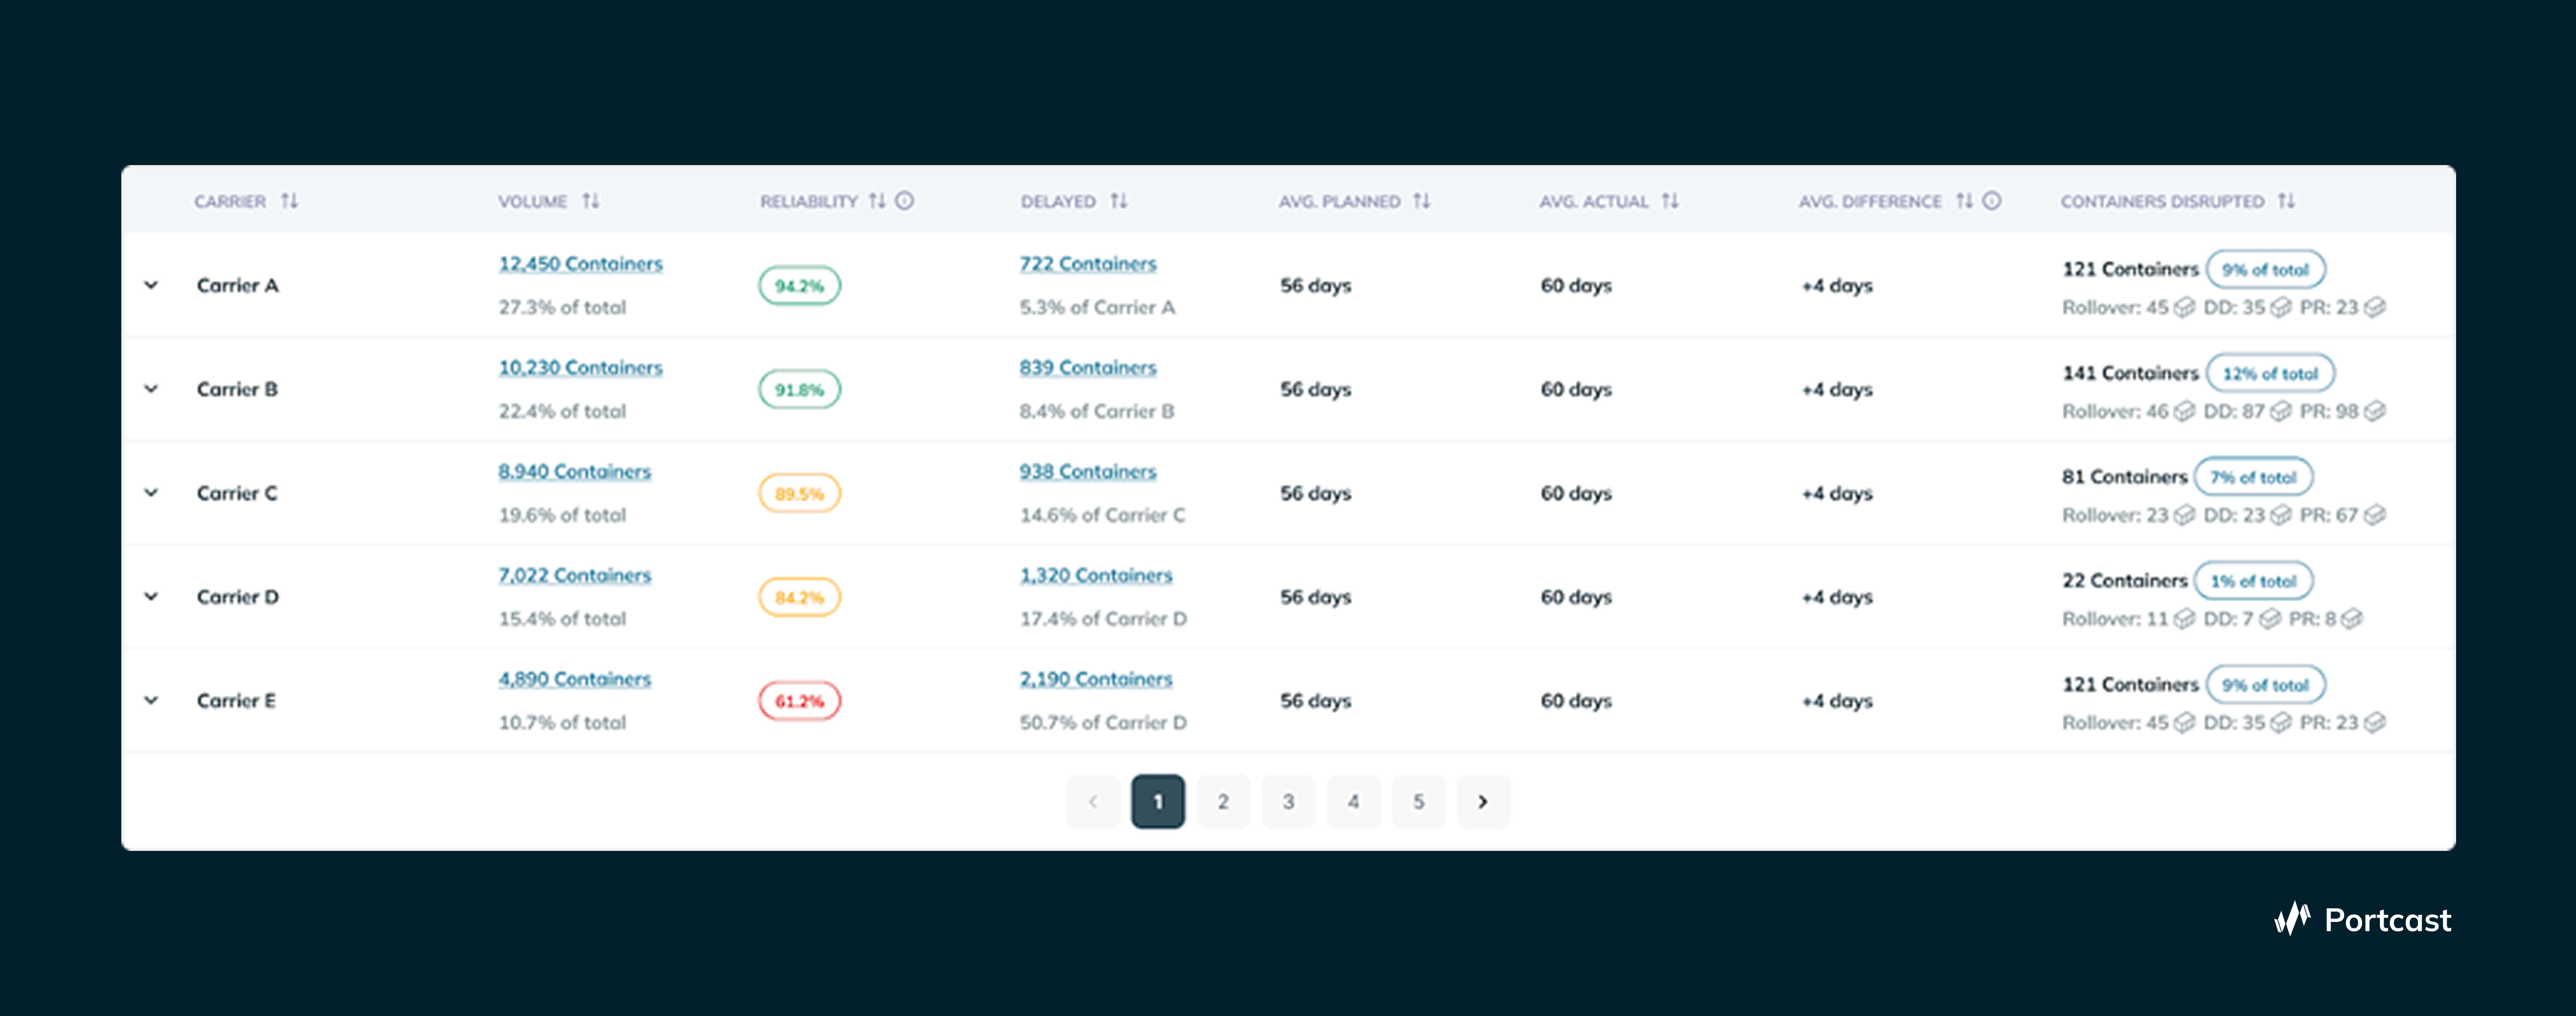
Procurement: Carrier Performance Data That Actually Means Something
Procurement teams in F&B supply chains are often overlooked in visibility conversations. They care deeply about what visibility data reveals once aggregated.
When your platform has been tracking your shipments for six months, it should maintain a structured record of how each carrier on each lane has actually performed: departure reliability, transit-time consistency, rollover frequency, and the correlation between scheduled ETAs and actual outcomes. This is carrier performance data you can take into a contract negotiation. Documented evidence, not anecdotal complaints.
For a perishable goods manufacturer, where carrier reliability directly affects product freshness, being able to demonstrate that a carrier's service on a specific lane has a 30% rollover rate that causes measurable shelf-life losses - and where exactly the bottlenecks causing that rollover happen - is a fundamentally different negotiating position.
Customer Relationships: Being the One Who Calls First
Every F&B company has experienced the situation where a customer calls to report a delay. It is a relationship moment that is hard to recover from.
When your team has 4 to 5 days of early warning on a delay, the entire downstream dynamic changes. You are calling your customer to inform them of the risk and explain how you are managing it. They can adjust their warehouse scheduling, production planning, and their own customer commitments. You are the partner who managed the disruption. That distinction compounds in value over the long term in commercial relationships in a way that is impossible to overstate.
6. What to Demand from a Predictive Visibility Tool
If you are currently evaluating predictive visibility solutions or reconsidering tools you already use, these are the questions that cut through the noise in the category.
7. Conclusion: The Earlier You Know, the Less You Lose
Return to the container at the transshipment port. Eleven days idle. Nine days from arrival. A customer SLA that will be violated on receipt.
Run the same scenario with a system that detected the initial vessel delay at day 3. Your team had 6 days to act. They escalated to the carrier, confirmed the delay, and called the customer 5 days before the original ETA. The customer adjusted their warehouse schedule. The product arrived below the SLA threshold, but the customer had already sourced a bridge supply to cover the gap. The relationship held. The batch was absorbed rather than destroyed.
The delay was identical. The outcome was entirely different. The difference was timing.
Accuracy is table stakes. The real question is whether your system knows early enough that knowing still changes something.
How Portcast approaches this for F&B supply chains
Portcast's predictive visibility is built on real-time ingestion of port-, lane-, and vessel-level risk signals, feeding into a prediction model that updates continuously as voyage conditions change. The command center surfaces exceptions based on your configured thresholds and integrates with your existing TMS, ERP, and planning tools, ensuring alerts and actions occur within the workflows your team already uses.
👉 If you'd like to explore how the solution works on your real shipment data, schedule a call with our expert team.