See Port Delays Before They Impact Your Shipments
Portcast monitors real-time and historical port congestion across 800+ ports worldwide, vessel waiting times, dwell, and traffic, in one interactive view. See which hubs are congested, which are deteriorating, and how they compare, then feed that data straight into your planning through the Portcast platform, Command Center, or Port Congestion API.
Get a Demo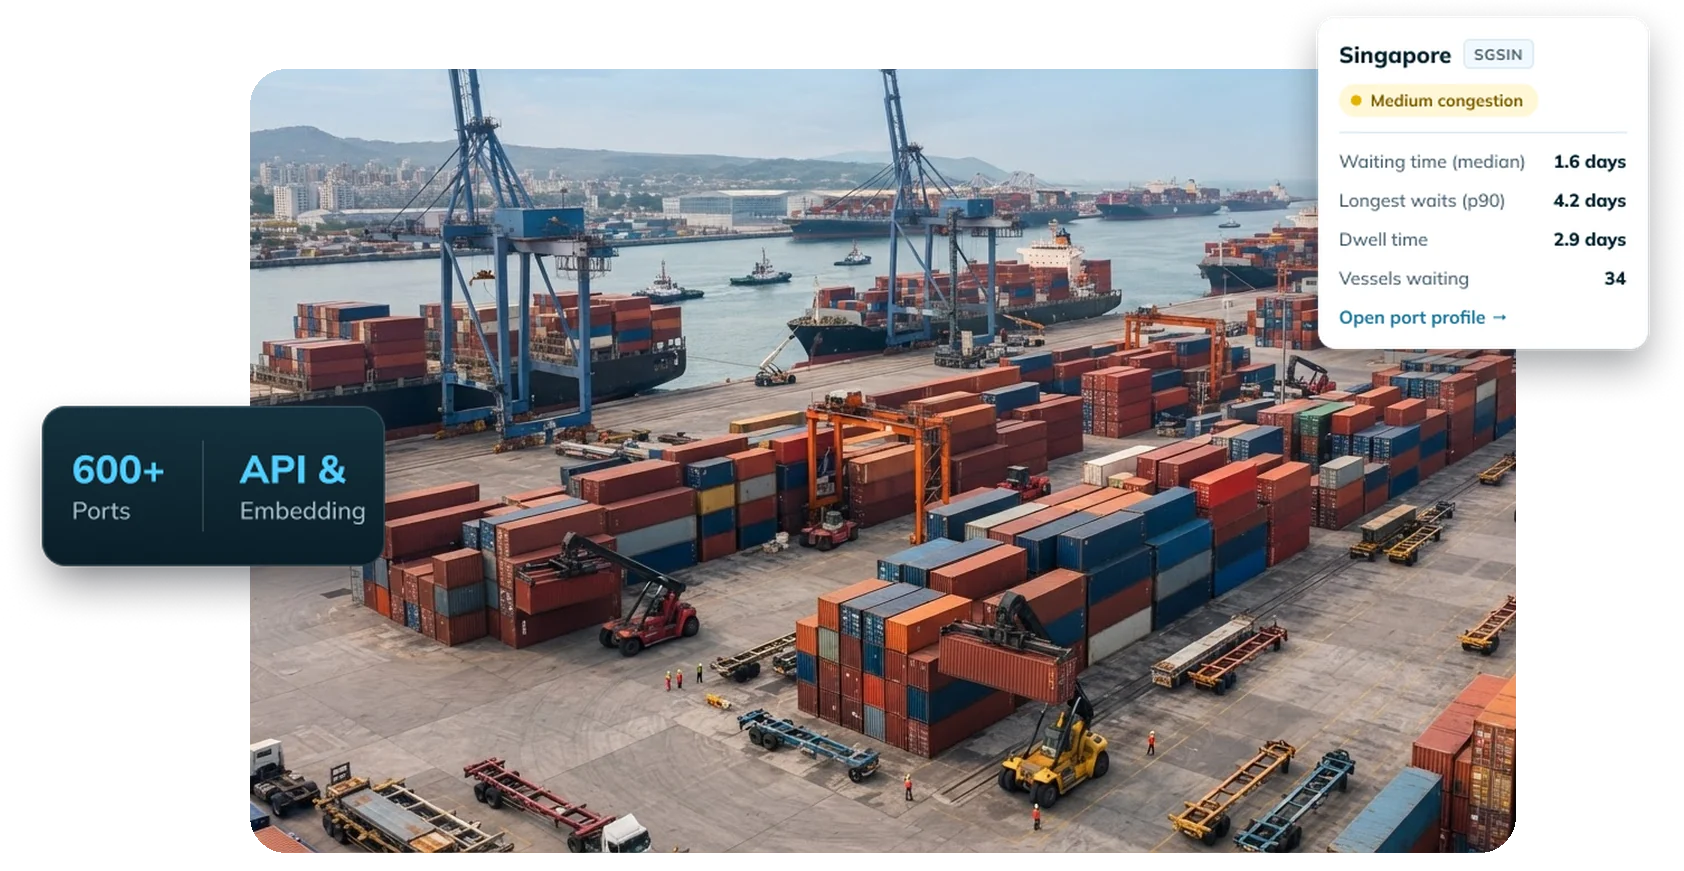
Port Congestion Costs You More Than Just Time
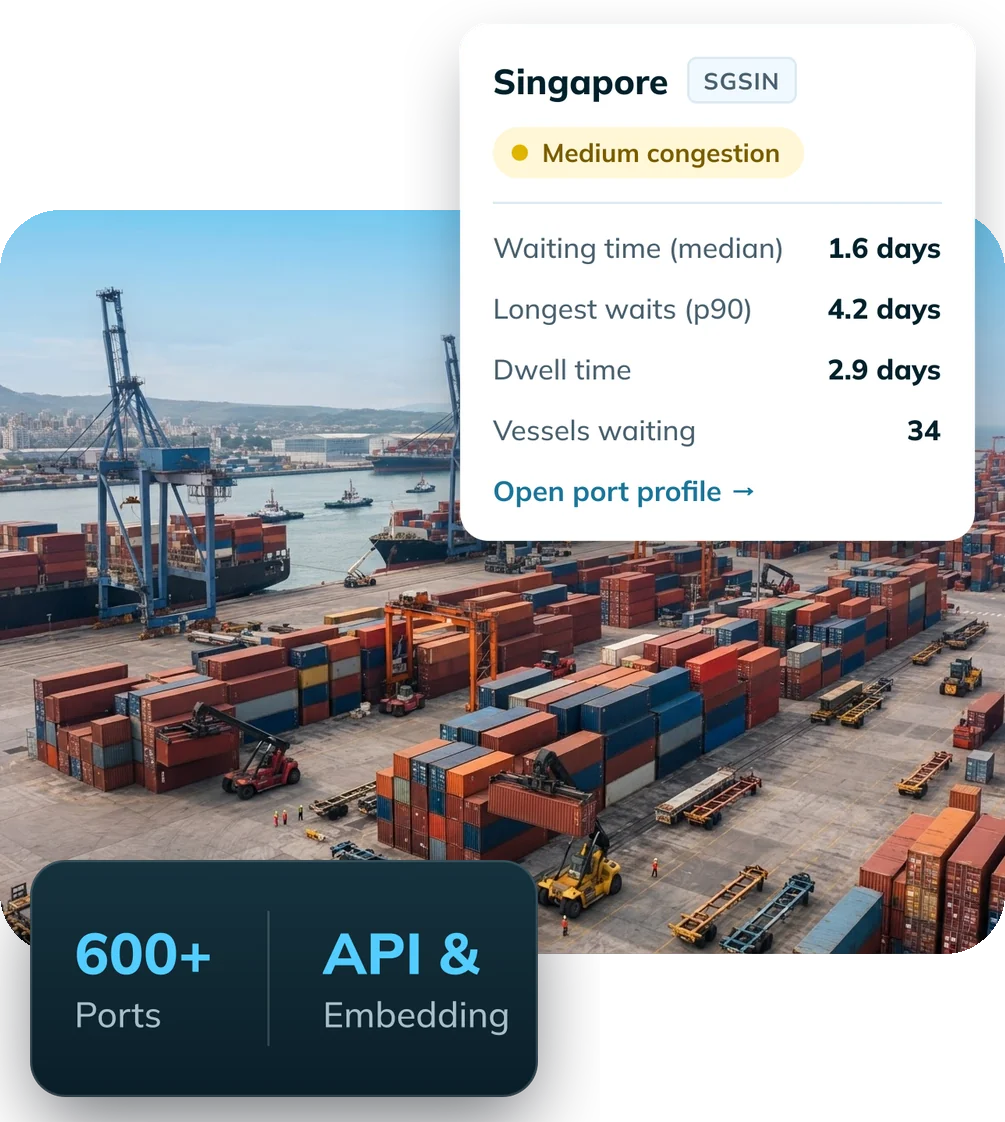
Congestion at a single port ripples through your whole operation, missed connections, demurrage, and customer calls you cannot answer. Most teams find out too late, from carrier updates that arrive after the vessel is already stuck. To plan around congestion instead of reacting to it, you need to see it clearly and early:
Find Out Too Late
Congestion often shows up in carrier updates only after a vessel is already waiting, too late to reroute, replan, or warn customers.
Port or Carrier?
When an ETA slips, teams often cannot tell if the delay is caused by the port or the vessel. Without knowing the cause, it is difficult to decide what to do next.
No Port Data, No Accurate Prediction
Planning tools and ETA models can run blind without a reliable congestion signal from the port feeding into them.
Key Features of Portcast's Port Congestion Monitoring
A Live Global Congestion Map
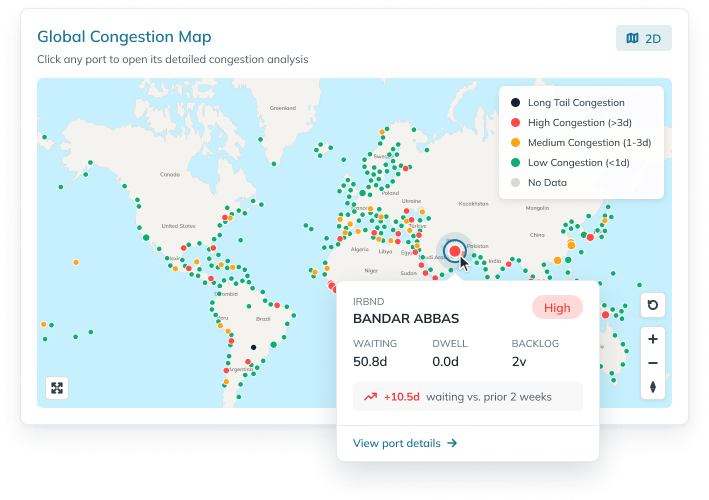
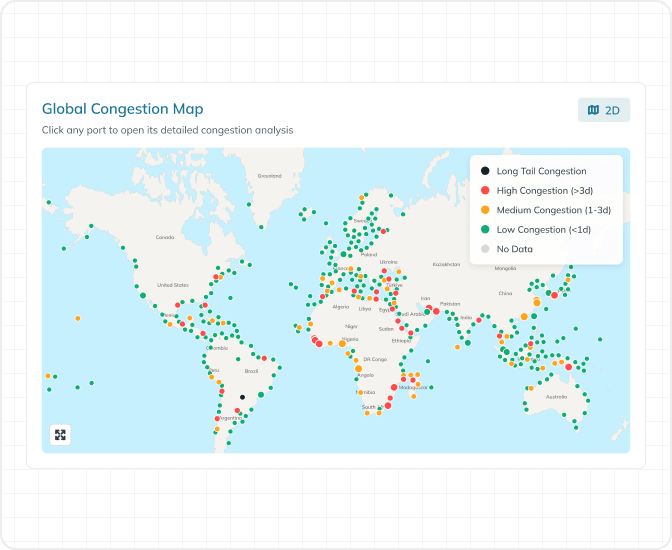
See congestion across 600+ ports at a glance. Every port appears as a coloured circle, sized by traffic and coloured by severity (low, medium, high), with a separate long-tail flag for ports where most vessels move normally but a minority face much longer waits. Switch between a flat 2D map and an interactive 3D globe, zoom to any region, and hover over a port for its key metrics.
Severity based on real vessel waiting time, not a generic score
Traffic and congestion shown together, so volume and delay are both visible
Click any port to open its full congestion profile
The Metrics Behind Port Congestion
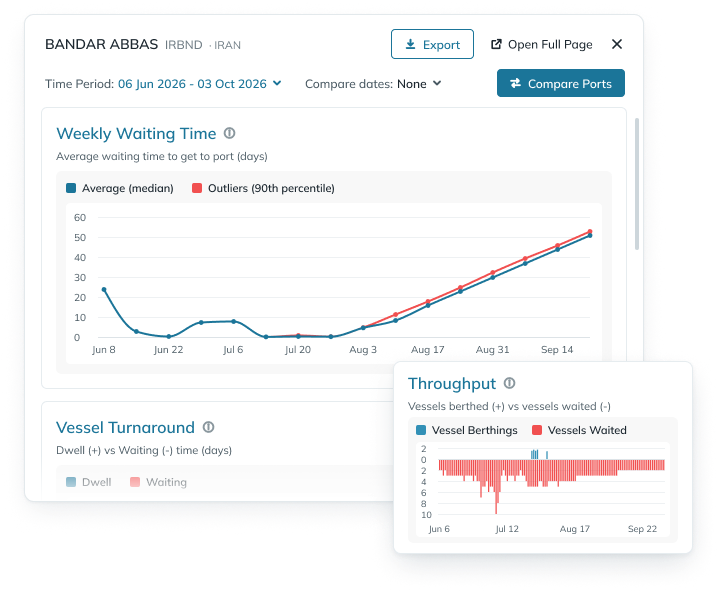
Portcast measures congestion using three simple metrics: vessel waiting time, which shows how long vessels wait before berthing; dwell time, which shows how long vessels stay at the port; and vessel traffic, which shows how busy the port is.
Weekly views give you the full picture, including delays that last several days. Each metric shows both the typical situation and the longest waits, so you can see when a small number of vessels are facing much longer delays.
Waiting and dwell time, showing both the typical wait and the longest waits.
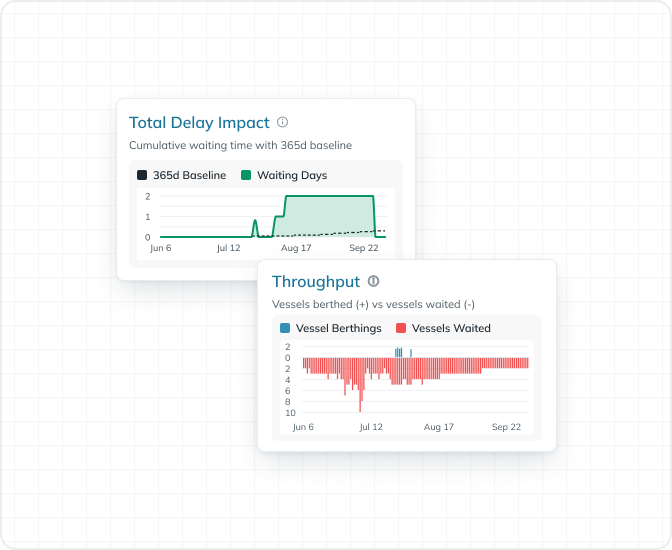
Daily port activity, including vessels arriving, vessels waiting, and total waiting time compared with the normal level.
Turnaround and throughput, bringing these metrics together for a quick view of how the port is performing.
Spot Port Deterioration Early
The fastest way to protect a shipment is to spot a port getting worse early. Portcast's “Most Congested Ports” leaderboard ranks the worst hubs on the latest data, and “Recent Shifts” surfaces the ports that changed most between two periods, so you can easily spot a deteriorating hub and confirm a recovering one.
Rank ports by most congested, highest dwell, or largest backlog
See week-over-week trend direction on every port
Surface the biggest movers between any two periods you choose

Compare Ports to Make Routing Decisions
When you have a choice of port, congestion can make the difference. Open any port’s deep-dive, select your time period, and use Compare Ports to benchmark it against alternatives across waiting and dwell time. Quickly see which ports are more congested and make booking decisions based on the conditions you can expect.
Benchmark one port against others across weekly and daily metrics
Compare two time periods to see how congestion and conditions are changing
Make better booking decisions by identifying congested or deteriorating hubs early and avoiding unnecessary risk
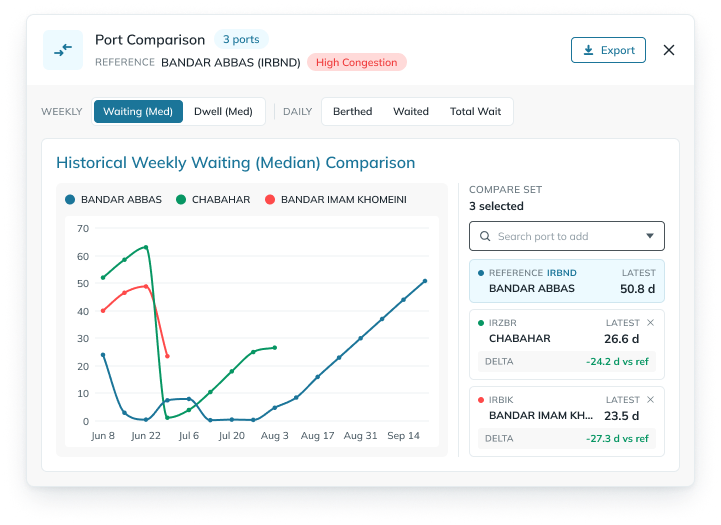
Understand Seasonality & Historical Performance
Congestion is not always a one-off event. Look back at historical port performance to understand normal conditions, spot recurring seasonal patterns, and see how congestion has changed over time. Use this context to plan with a better view of what to expect.
See how waiting and dwell times change over weeks, months, and seasons
Compare current congestion with historical performance to spot unusual changes
Identify recurring congestion patterns and periods of higher risk

Port Congestion API & Embed
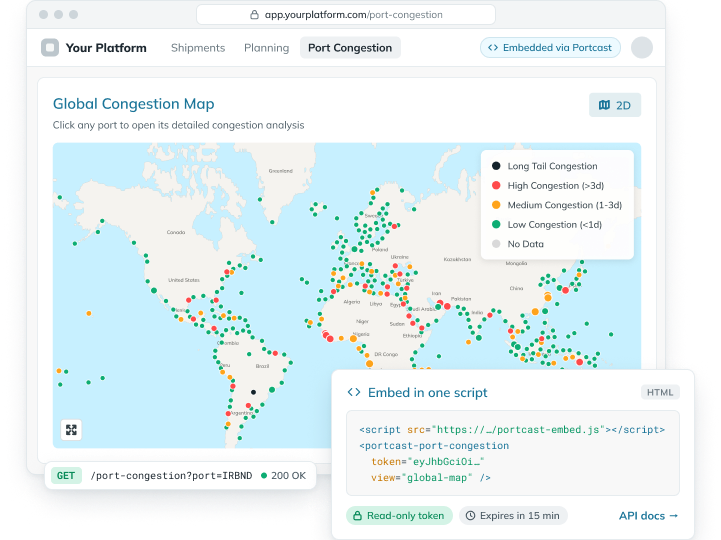
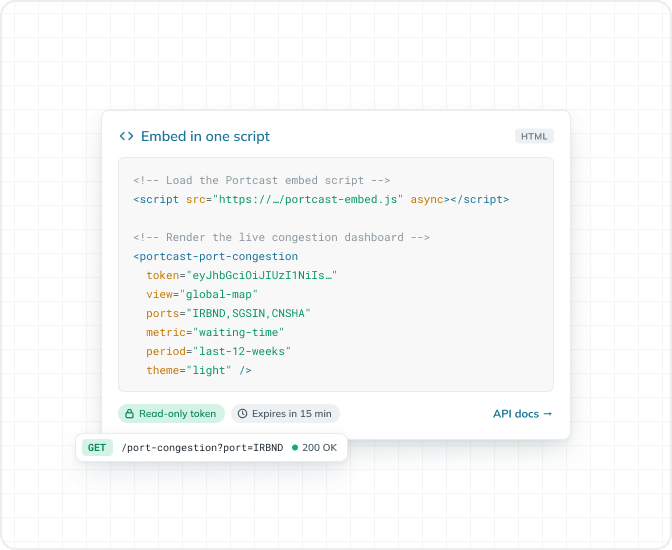
Bring congestion data directly into the systems your team already uses. Use the Portcast API to feed real-time and historical congestion data into your TMS, ERP, or ETA models, or embed the interactive dashboard directly into your own platform with a single script and a secure, short-lived token.
Pull real-time and historical congestion data through the Port Congestion API
Embed the interactive dashboard in your own platform with a secure, read-only token
Add a reliable port congestion signal to planning tools and ETA models that lack one
How Portcast's Port Congestion Monitoring Works
Track shipments, predict delays, and act early.
Go Beyond Waiting Times to Understand Port Congestion
Many tools show typical waiting times or basic port conditions. Portcast gives you the historical depth, comparisons, and integration needed to understand congestion and make better booking and planning decisions.


Congestion Data That Makes Your Arrival Predictions Sharper
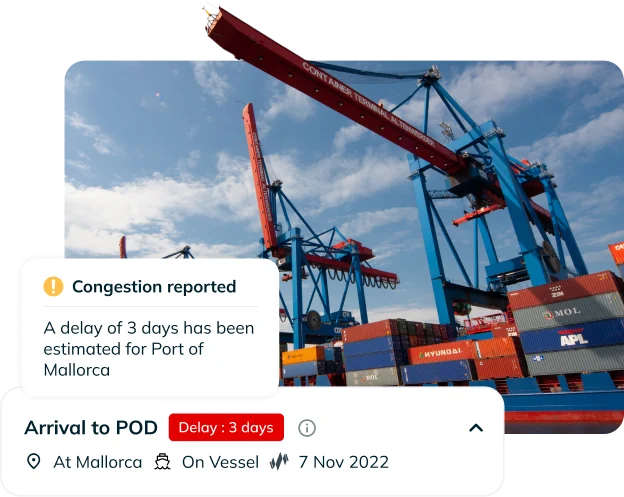
Port congestion is one of the biggest causes of delay in ocean freight, which is why Portcast feeds it directly into its predictive ETAs. Congestion here is not an isolated dashboard; it is a signal that makes container arrival predictions more accurate, and that explains why an ETA has shifted when a port backs up.
Hear What Our Customers Are Saying




Portcast helps you to predict at an early stage how outside circumstances like weather, port congestion, and strikes may impact your and your customer's downstream processes.
Port Congestion Intelligence for Every Team
Logistics and Operations Teams
Stop reactive firefighting. See which key ports are congested or deteriorating, and base customer expectations and booking decisions on data rather than carrier updates that arrive too late.
Freight Forwarders and 3PLs
Monitor congestion across all the ports your clients’ shipments touch in one view, explain delays with evidence, and embed the dashboard in your own customer-facing platform.
Supply Chain Platforms and TMS Providers
Feed historical and up-to-date port congestion data into your product through the API and give your ETA models the port intelligence they are missing.

Port Congestion Monitoring: Frequently Asked Questions
Any other question that isn’t mentioned? Don't hesitate to get in touch.
What is port congestion monitoring software?
Which ports does Portcast cover for congestion monitoring?
How does Portcast measure port congestion?
Does Portcast have a port congestion API?
Can I embed the port congestion dashboard in my own platform?
How is Portcast's port congestion data different from a free port authority dashboard?
Can port congestion data help reduce demurrage and detention?
How does port congestion affect ETA predictions?
Learn More About Port Congestion
Get Port Congestion Intelligence Built for Your Operations Stack

 Get a Demo
